Greek vs Immigrants from Syria Unemployment Among Ages 45 to 54 years
COMPARE
Greek
Immigrants from Syria
Unemployment Among Ages 45 to 54 years
Unemployment Among Ages 45 to 54 years Comparison
Greeks
Immigrants from Syria
4.3%
UNEMPLOYMENT AMONG AGES 45 TO 54 YEARS
99.3/ 100
METRIC RATING
58th/ 347
METRIC RANK
4.8%
UNEMPLOYMENT AMONG AGES 45 TO 54 YEARS
0.9/ 100
METRIC RATING
246th/ 347
METRIC RANK
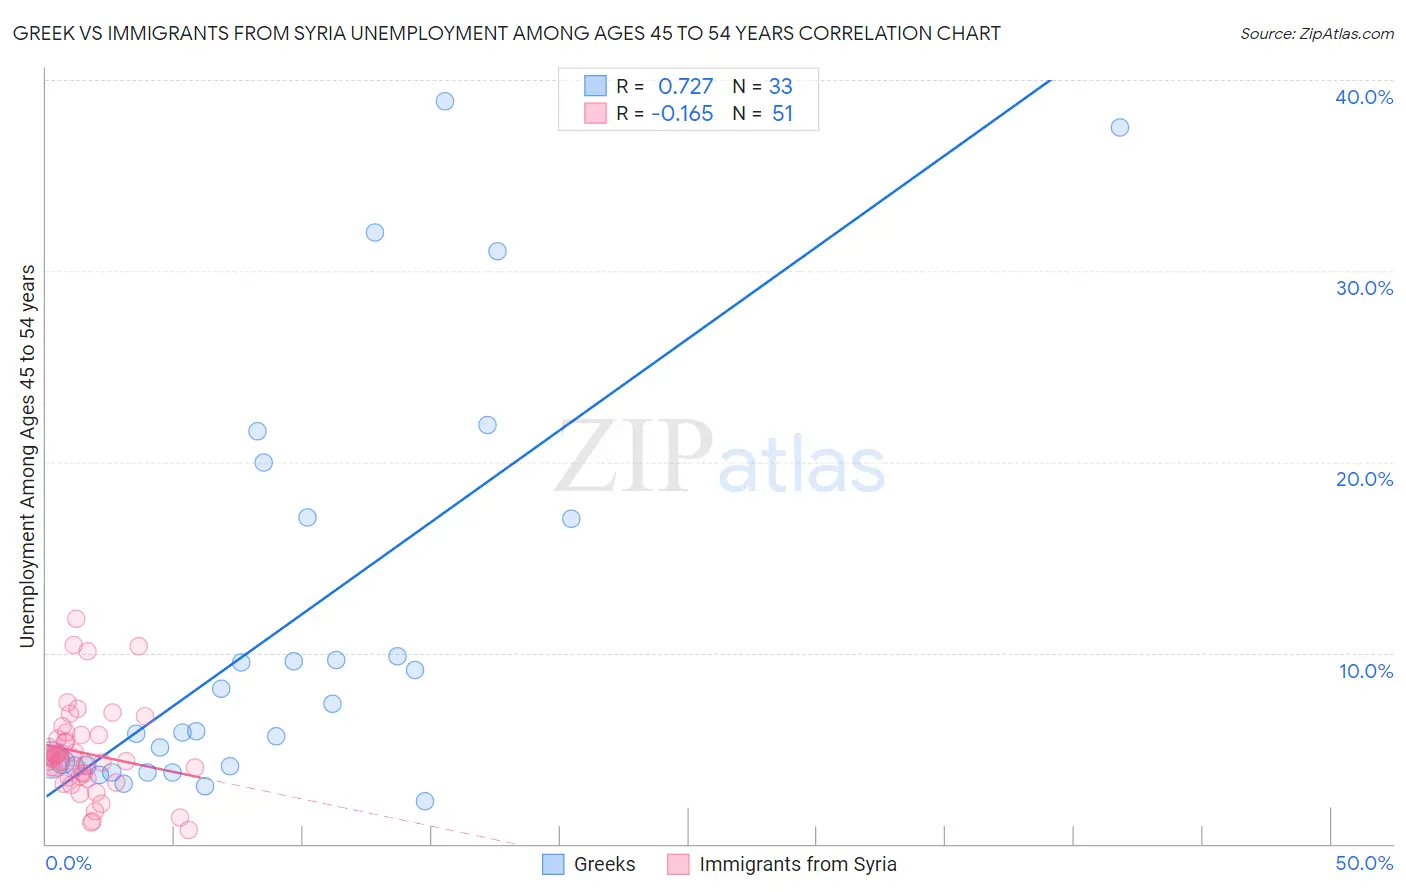
Greek vs Immigrants from Syria Unemployment Among Ages 45 to 54 years Correlation Chart
The statistical analysis conducted on geographies consisting of 463,102,299 people shows a strong positive correlation between the proportion of Greeks and unemployment rate among population between the ages 45 and 54 in the United States with a correlation coefficient (R) of 0.727 and weighted average of 4.3%. Similarly, the statistical analysis conducted on geographies consisting of 172,873,255 people shows a poor negative correlation between the proportion of Immigrants from Syria and unemployment rate among population between the ages 45 and 54 in the United States with a correlation coefficient (R) of -0.165 and weighted average of 4.8%, a difference of 11.9%.
Unemployment Among Ages 45 to 54 years Correlation Summary
| Measurement | Greek | Immigrants from Syria |
| Minimum | 2.2% | 0.70% |
| Maximum | 38.9% | 11.8% |
| Range | 36.7% | 11.1% |
| Mean | 11.3% | 4.7% |
| Median | 5.9% | 4.5% |
| Interquartile 25% (IQ1) | 4.0% | 3.5% |
| Interquartile 75% (IQ3) | 17.1% | 5.7% |
| Interquartile Range (IQR) | 13.0% | 2.2% |
| Standard Deviation (Sample) | 10.5% | 2.3% |
| Standard Deviation (Population) | 10.3% | 2.3% |
Similar Demographics by Unemployment Among Ages 45 to 54 years
Demographics Similar to Greeks by Unemployment Among Ages 45 to 54 years
In terms of unemployment among ages 45 to 54 years, the demographic groups most similar to Greeks are Immigrants from Sri Lanka (4.3%, a difference of 0.050%), Okinawan (4.3%, a difference of 0.080%), Immigrants from Jordan (4.3%, a difference of 0.11%), Immigrants from Korea (4.3%, a difference of 0.11%), and Immigrants from Pakistan (4.3%, a difference of 0.11%).
| Demographics | Rating | Rank | Unemployment Among Ages 45 to 54 years |
| Burmese | 99.6 /100 | #51 | Exceptional 4.2% |
| Poles | 99.5 /100 | #52 | Exceptional 4.2% |
| Irish | 99.5 /100 | #53 | Exceptional 4.2% |
| Chickasaw | 99.5 /100 | #54 | Exceptional 4.2% |
| Latvians | 99.4 /100 | #55 | Exceptional 4.2% |
| Immigrants | Jordan | 99.3 /100 | #56 | Exceptional 4.3% |
| Immigrants | Sri Lanka | 99.3 /100 | #57 | Exceptional 4.3% |
| Greeks | 99.3 /100 | #58 | Exceptional 4.3% |
| Okinawans | 99.2 /100 | #59 | Exceptional 4.3% |
| Immigrants | Korea | 99.2 /100 | #60 | Exceptional 4.3% |
| Immigrants | Pakistan | 99.2 /100 | #61 | Exceptional 4.3% |
| Lithuanians | 99.1 /100 | #62 | Exceptional 4.3% |
| Pennsylvania Germans | 99.1 /100 | #63 | Exceptional 4.3% |
| Austrians | 99.0 /100 | #64 | Exceptional 4.3% |
| Immigrants | Sudan | 99.0 /100 | #65 | Exceptional 4.3% |
Demographics Similar to Immigrants from Syria by Unemployment Among Ages 45 to 54 years
In terms of unemployment among ages 45 to 54 years, the demographic groups most similar to Immigrants from Syria are Immigrants from Albania (4.8%, a difference of 0.010%), Israeli (4.8%, a difference of 0.050%), Seminole (4.8%, a difference of 0.16%), Immigrants from Liberia (4.8%, a difference of 0.16%), and Portuguese (4.8%, a difference of 0.22%).
| Demographics | Rating | Rank | Unemployment Among Ages 45 to 54 years |
| Spanish Americans | 1.4 /100 | #239 | Tragic 4.7% |
| Immigrants | Iraq | 1.3 /100 | #240 | Tragic 4.7% |
| Delaware | 1.3 /100 | #241 | Tragic 4.8% |
| Central Americans | 1.3 /100 | #242 | Tragic 4.8% |
| Portuguese | 1.1 /100 | #243 | Tragic 4.8% |
| Seminole | 1.1 /100 | #244 | Tragic 4.8% |
| Immigrants | Albania | 0.9 /100 | #245 | Tragic 4.8% |
| Immigrants | Syria | 0.9 /100 | #246 | Tragic 4.8% |
| Israelis | 0.9 /100 | #247 | Tragic 4.8% |
| Immigrants | Liberia | 0.8 /100 | #248 | Tragic 4.8% |
| Immigrants | Honduras | 0.7 /100 | #249 | Tragic 4.8% |
| Salvadorans | 0.7 /100 | #250 | Tragic 4.8% |
| Hondurans | 0.4 /100 | #251 | Tragic 4.8% |
| Immigrants | Bahamas | 0.3 /100 | #252 | Tragic 4.8% |
| Moroccans | 0.3 /100 | #253 | Tragic 4.8% |