Immigrants from Lebanon vs Blackfeet Unemployment Among Ages 45 to 54 years
COMPARE
Immigrants from Lebanon
Blackfeet
Unemployment Among Ages 45 to 54 years
Unemployment Among Ages 45 to 54 years Comparison
Immigrants from Lebanon
Blackfeet
4.8%
UNEMPLOYMENT AMONG AGES 45 TO 54 YEARS
0.2/ 100
METRIC RATING
254th/ 347
METRIC RANK
5.1%
UNEMPLOYMENT AMONG AGES 45 TO 54 YEARS
0.0/ 100
METRIC RATING
280th/ 347
METRIC RANK
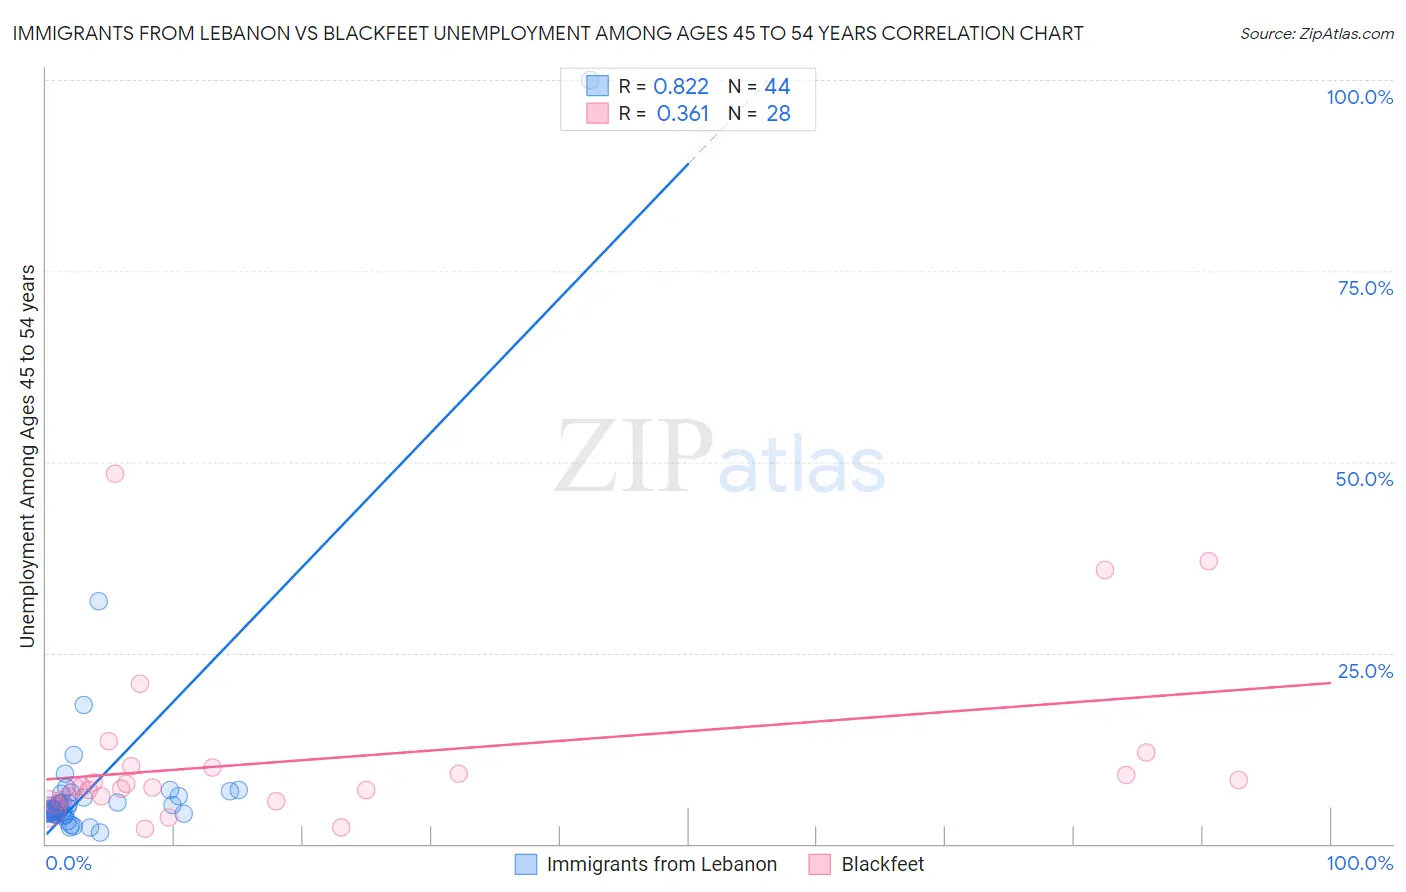
Immigrants from Lebanon vs Blackfeet Unemployment Among Ages 45 to 54 years Correlation Chart
The statistical analysis conducted on geographies consisting of 215,185,312 people shows a very strong positive correlation between the proportion of Immigrants from Lebanon and unemployment rate among population between the ages 45 and 54 in the United States with a correlation coefficient (R) of 0.822 and weighted average of 4.8%. Similarly, the statistical analysis conducted on geographies consisting of 302,050,143 people shows a mild positive correlation between the proportion of Blackfeet and unemployment rate among population between the ages 45 and 54 in the United States with a correlation coefficient (R) of 0.361 and weighted average of 5.1%, a difference of 4.4%.
Unemployment Among Ages 45 to 54 years Correlation Summary
| Measurement | Immigrants from Lebanon | Blackfeet |
| Minimum | 1.5% | 2.0% |
| Maximum | 100.0% | 48.4% |
| Range | 98.5% | 46.4% |
| Mean | 8.0% | 11.2% |
| Median | 4.5% | 7.6% |
| Interquartile 25% (IQ1) | 4.0% | 6.0% |
| Interquartile 75% (IQ3) | 6.4% | 10.1% |
| Interquartile Range (IQR) | 2.4% | 4.1% |
| Standard Deviation (Sample) | 15.0% | 11.1% |
| Standard Deviation (Population) | 14.8% | 10.9% |
Similar Demographics by Unemployment Among Ages 45 to 54 years
Demographics Similar to Immigrants from Lebanon by Unemployment Among Ages 45 to 54 years
In terms of unemployment among ages 45 to 54 years, the demographic groups most similar to Immigrants from Lebanon are Immigrants from El Salvador (4.8%, a difference of 0.13%), Immigrants from Western Asia (4.8%, a difference of 0.20%), Moroccan (4.8%, a difference of 0.22%), Immigrants from Western Africa (4.9%, a difference of 0.35%), and Subsaharan African (4.9%, a difference of 0.38%).
| Demographics | Rating | Rank | Unemployment Among Ages 45 to 54 years |
| Israelis | 0.9 /100 | #247 | Tragic 4.8% |
| Immigrants | Liberia | 0.8 /100 | #248 | Tragic 4.8% |
| Immigrants | Honduras | 0.7 /100 | #249 | Tragic 4.8% |
| Salvadorans | 0.7 /100 | #250 | Tragic 4.8% |
| Hondurans | 0.4 /100 | #251 | Tragic 4.8% |
| Immigrants | Bahamas | 0.3 /100 | #252 | Tragic 4.8% |
| Moroccans | 0.3 /100 | #253 | Tragic 4.8% |
| Immigrants | Lebanon | 0.2 /100 | #254 | Tragic 4.8% |
| Immigrants | El Salvador | 0.2 /100 | #255 | Tragic 4.8% |
| Immigrants | Western Asia | 0.2 /100 | #256 | Tragic 4.8% |
| Immigrants | Western Africa | 0.2 /100 | #257 | Tragic 4.9% |
| Sub-Saharan Africans | 0.2 /100 | #258 | Tragic 4.9% |
| Ugandans | 0.1 /100 | #259 | Tragic 4.9% |
| Mexican American Indians | 0.1 /100 | #260 | Tragic 4.9% |
| Guatemalans | 0.1 /100 | #261 | Tragic 4.9% |
Demographics Similar to Blackfeet by Unemployment Among Ages 45 to 54 years
In terms of unemployment among ages 45 to 54 years, the demographic groups most similar to Blackfeet are Spanish American Indian (5.1%, a difference of 0.080%), Nepalese (5.0%, a difference of 0.21%), African (5.1%, a difference of 0.23%), Dutch West Indian (5.0%, a difference of 0.35%), and Immigrants from Mexico (5.0%, a difference of 0.55%).
| Demographics | Rating | Rank | Unemployment Among Ages 45 to 54 years |
| Immigrants | Latin America | 0.0 /100 | #273 | Tragic 5.0% |
| U.S. Virgin Islanders | 0.0 /100 | #274 | Tragic 5.0% |
| Bermudans | 0.0 /100 | #275 | Tragic 5.0% |
| French American Indians | 0.0 /100 | #276 | Tragic 5.0% |
| Immigrants | Mexico | 0.0 /100 | #277 | Tragic 5.0% |
| Dutch West Indians | 0.0 /100 | #278 | Tragic 5.0% |
| Nepalese | 0.0 /100 | #279 | Tragic 5.0% |
| Blackfeet | 0.0 /100 | #280 | Tragic 5.1% |
| Spanish American Indians | 0.0 /100 | #281 | Tragic 5.1% |
| Africans | 0.0 /100 | #282 | Tragic 5.1% |
| Hispanics or Latinos | 0.0 /100 | #283 | Tragic 5.1% |
| Kiowa | 0.0 /100 | #284 | Tragic 5.1% |
| Iroquois | 0.0 /100 | #285 | Tragic 5.1% |
| Senegalese | 0.0 /100 | #286 | Tragic 5.1% |
| Haitians | 0.0 /100 | #287 | Tragic 5.2% |