Greek vs Bhutanese 7th Grade
COMPARE
Greek
Bhutanese
7th Grade
7th Grade Comparison
Greeks
Bhutanese
97.0%
7TH GRADE
99.9/ 100
METRIC RATING
52nd/ 347
METRIC RANK
96.6%
7TH GRADE
97.7/ 100
METRIC RATING
109th/ 347
METRIC RANK
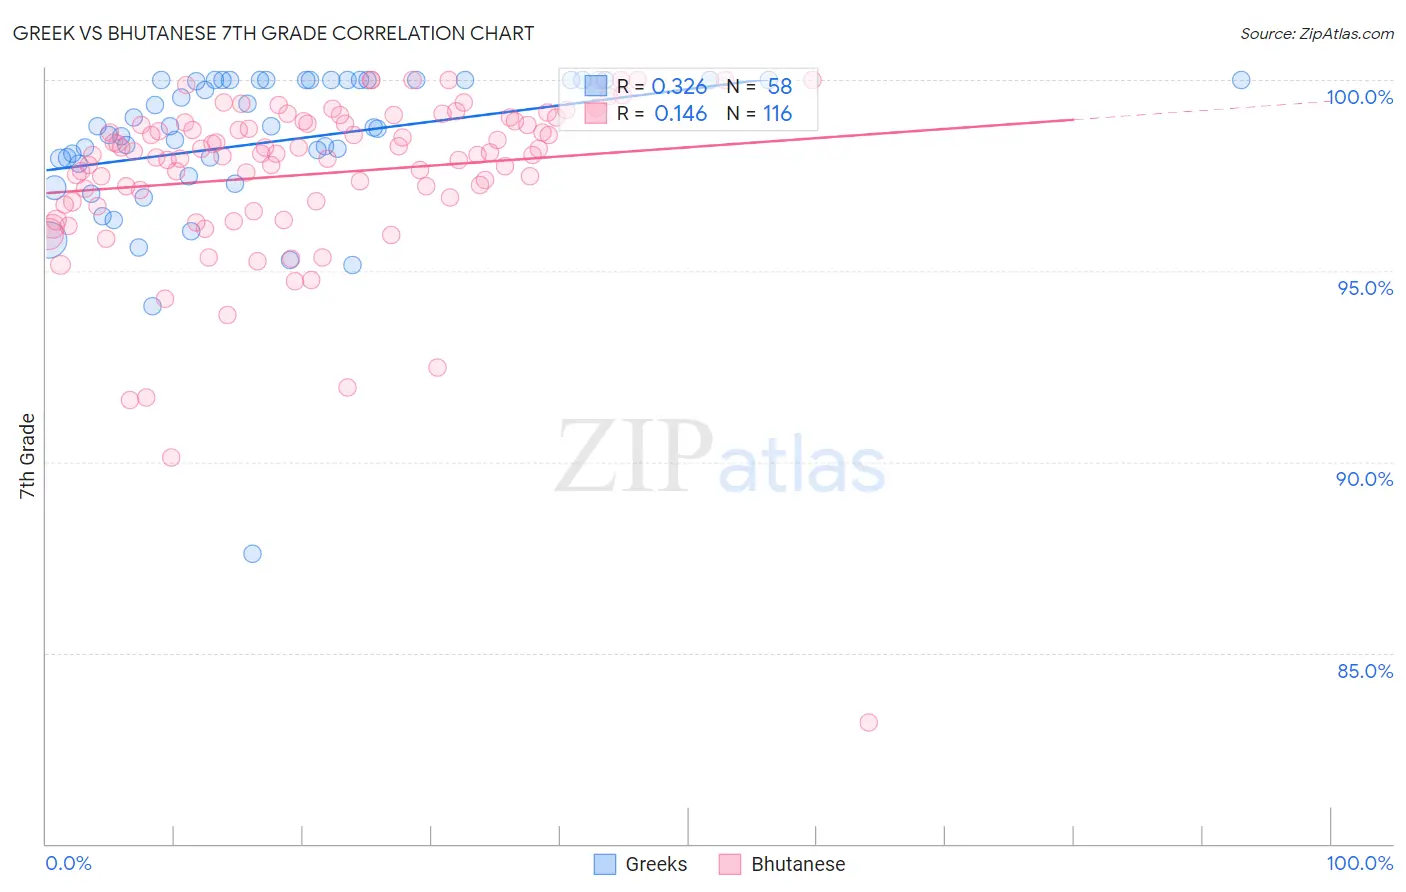
Greek vs Bhutanese 7th Grade Correlation Chart
The statistical analysis conducted on geographies consisting of 482,775,358 people shows a mild positive correlation between the proportion of Greeks and percentage of population with at least 7th grade education in the United States with a correlation coefficient (R) of 0.326 and weighted average of 97.0%. Similarly, the statistical analysis conducted on geographies consisting of 455,591,134 people shows a poor positive correlation between the proportion of Bhutanese and percentage of population with at least 7th grade education in the United States with a correlation coefficient (R) of 0.146 and weighted average of 96.6%, a difference of 0.43%.
7th Grade Correlation Summary
| Measurement | Greek | Bhutanese |
| Minimum | 87.6% | 83.2% |
| Maximum | 100.0% | 100.0% |
| Range | 12.4% | 16.8% |
| Mean | 98.4% | 97.5% |
| Median | 98.8% | 98.1% |
| Interquartile 25% (IQ1) | 97.8% | 96.8% |
| Interquartile 75% (IQ3) | 100.0% | 98.9% |
| Interquartile Range (IQR) | 2.2% | 2.1% |
| Standard Deviation (Sample) | 2.1% | 2.3% |
| Standard Deviation (Population) | 2.1% | 2.3% |
Similar Demographics by 7th Grade
Demographics Similar to Greeks by 7th Grade
In terms of 7th grade, the demographic groups most similar to Greeks are Austrian (97.0%, a difference of 0.010%), Estonian (97.0%, a difference of 0.020%), Australian (97.0%, a difference of 0.030%), Russian (97.0%, a difference of 0.040%), and Serbian (97.0%, a difference of 0.040%).
| Demographics | Rating | Rank | 7th Grade |
| Czechoslovakians | 99.9 /100 | #45 | Exceptional 97.1% |
| Aleuts | 99.9 /100 | #46 | Exceptional 97.1% |
| Bulgarians | 99.9 /100 | #47 | Exceptional 97.1% |
| Celtics | 99.9 /100 | #48 | Exceptional 97.1% |
| Slavs | 99.9 /100 | #49 | Exceptional 97.1% |
| Immigrants | Scotland | 99.9 /100 | #50 | Exceptional 97.1% |
| Estonians | 99.9 /100 | #51 | Exceptional 97.0% |
| Greeks | 99.9 /100 | #52 | Exceptional 97.0% |
| Austrians | 99.8 /100 | #53 | Exceptional 97.0% |
| Australians | 99.8 /100 | #54 | Exceptional 97.0% |
| Russians | 99.8 /100 | #55 | Exceptional 97.0% |
| Serbians | 99.8 /100 | #56 | Exceptional 97.0% |
| Americans | 99.8 /100 | #57 | Exceptional 97.0% |
| Whites/Caucasians | 99.8 /100 | #58 | Exceptional 97.0% |
| Macedonians | 99.8 /100 | #59 | Exceptional 97.0% |
Demographics Similar to Bhutanese by 7th Grade
In terms of 7th grade, the demographic groups most similar to Bhutanese are Lumbee (96.6%, a difference of 0.010%), Immigrants from Saudi Arabia (96.6%, a difference of 0.010%), Iroquois (96.6%, a difference of 0.020%), Okinawan (96.6%, a difference of 0.020%), and Immigrants from Latvia (96.6%, a difference of 0.020%).
| Demographics | Rating | Rank | 7th Grade |
| Immigrants | Czechoslovakia | 98.3 /100 | #102 | Exceptional 96.6% |
| Immigrants | Singapore | 98.3 /100 | #103 | Exceptional 96.6% |
| Shoshone | 98.1 /100 | #104 | Exceptional 96.6% |
| South Africans | 98.0 /100 | #105 | Exceptional 96.6% |
| Iroquois | 97.9 /100 | #106 | Exceptional 96.6% |
| Lumbee | 97.8 /100 | #107 | Exceptional 96.6% |
| Immigrants | Saudi Arabia | 97.8 /100 | #108 | Exceptional 96.6% |
| Bhutanese | 97.7 /100 | #109 | Exceptional 96.6% |
| Okinawans | 97.4 /100 | #110 | Exceptional 96.6% |
| Immigrants | Latvia | 97.4 /100 | #111 | Exceptional 96.6% |
| Immigrants | Nonimmigrants | 97.0 /100 | #112 | Exceptional 96.5% |
| Pueblo | 96.8 /100 | #113 | Exceptional 96.5% |
| Immigrants | Zimbabwe | 96.6 /100 | #114 | Exceptional 96.5% |
| Choctaw | 96.6 /100 | #115 | Exceptional 96.5% |
| Syrians | 96.6 /100 | #116 | Exceptional 96.5% |