Italian vs Immigrants from Ethiopia Unemployment Among Ages 45 to 54 years
COMPARE
Italian
Immigrants from Ethiopia
Unemployment Among Ages 45 to 54 years
Unemployment Among Ages 45 to 54 years Comparison
Italians
Immigrants from Ethiopia
4.3%
UNEMPLOYMENT AMONG AGES 45 TO 54 YEARS
97.3/ 100
METRIC RATING
84th/ 347
METRIC RANK
4.4%
UNEMPLOYMENT AMONG AGES 45 TO 54 YEARS
96.1/ 100
METRIC RATING
95th/ 347
METRIC RANK
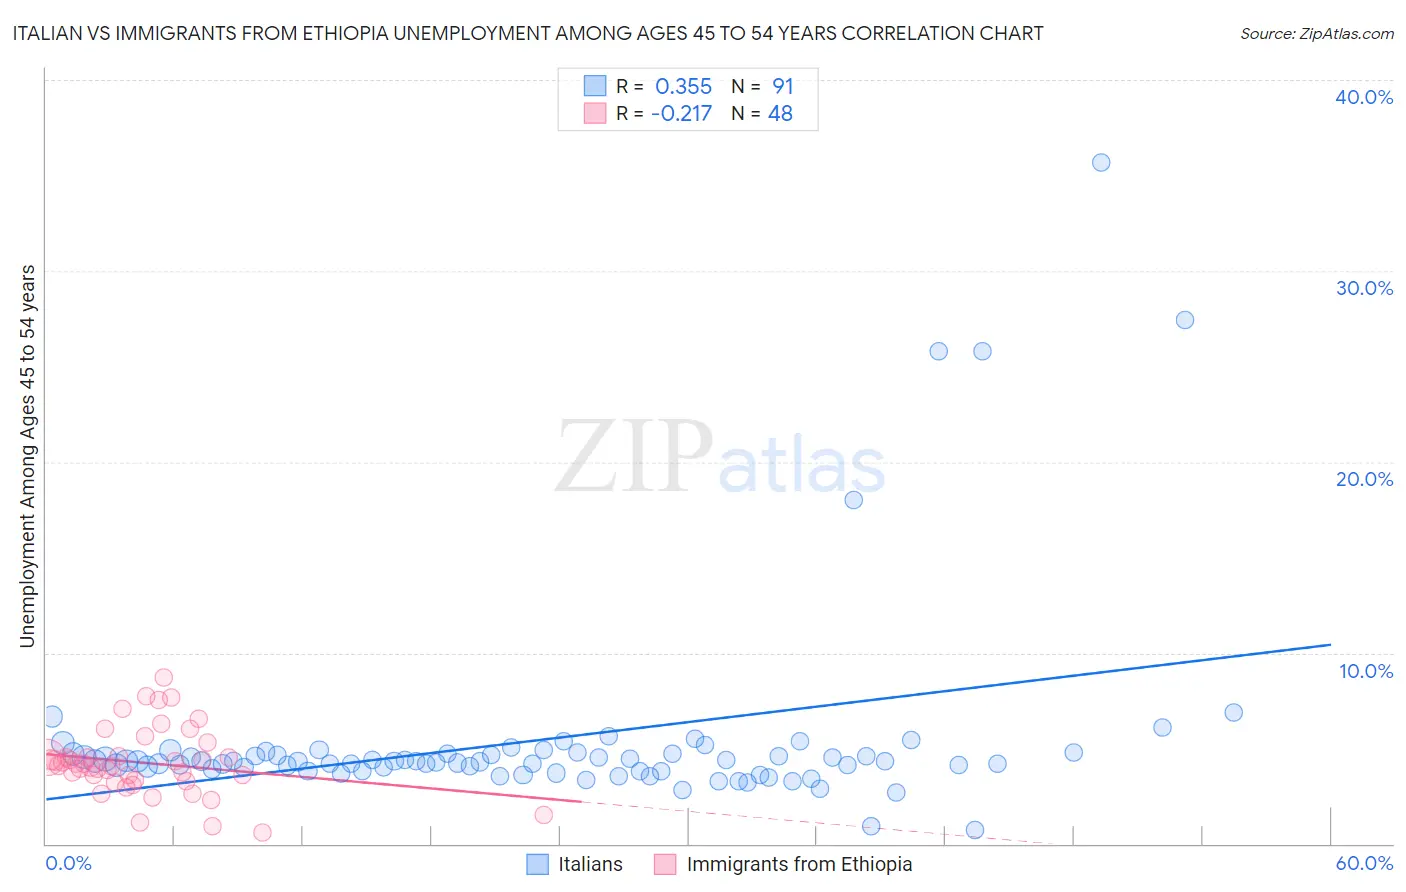
Italian vs Immigrants from Ethiopia Unemployment Among Ages 45 to 54 years Correlation Chart
The statistical analysis conducted on geographies consisting of 531,524,009 people shows a mild positive correlation between the proportion of Italians and unemployment rate among population between the ages 45 and 54 in the United States with a correlation coefficient (R) of 0.355 and weighted average of 4.3%. Similarly, the statistical analysis conducted on geographies consisting of 209,092,929 people shows a weak negative correlation between the proportion of Immigrants from Ethiopia and unemployment rate among population between the ages 45 and 54 in the United States with a correlation coefficient (R) of -0.217 and weighted average of 4.4%, a difference of 0.49%.
Unemployment Among Ages 45 to 54 years Correlation Summary
| Measurement | Italian | Immigrants from Ethiopia |
| Minimum | 0.70% | 0.60% |
| Maximum | 35.7% | 8.7% |
| Range | 35.0% | 8.1% |
| Mean | 5.5% | 4.2% |
| Median | 4.3% | 4.2% |
| Interquartile 25% (IQ1) | 3.8% | 3.3% |
| Interquartile 75% (IQ3) | 4.7% | 4.6% |
| Interquartile Range (IQR) | 0.89% | 1.2% |
| Standard Deviation (Sample) | 5.4% | 1.8% |
| Standard Deviation (Population) | 5.3% | 1.7% |
Demographics Similar to Italians and Immigrants from Ethiopia by Unemployment Among Ages 45 to 54 years
In terms of unemployment among ages 45 to 54 years, the demographic groups most similar to Italians are French (4.3%, a difference of 0.0%), Australian (4.3%, a difference of 0.040%), Ethiopian (4.3%, a difference of 0.040%), Eastern European (4.3%, a difference of 0.12%), and Sudanese (4.3%, a difference of 0.14%). Similarly, the demographic groups most similar to Immigrants from Ethiopia are Immigrants from Malaysia (4.4%, a difference of 0.040%), Argentinean (4.3%, a difference of 0.16%), Mongolian (4.3%, a difference of 0.17%), Ukrainian (4.3%, a difference of 0.19%), and Indonesian (4.4%, a difference of 0.19%).
| Demographics | Rating | Rank | Unemployment Among Ages 45 to 54 years |
| Serbians | 97.9 /100 | #79 | Exceptional 4.3% |
| Cambodians | 97.8 /100 | #80 | Exceptional 4.3% |
| Immigrants | Micronesia | 97.6 /100 | #81 | Exceptional 4.3% |
| Eastern Europeans | 97.6 /100 | #82 | Exceptional 4.3% |
| Australians | 97.4 /100 | #83 | Exceptional 4.3% |
| Italians | 97.3 /100 | #84 | Exceptional 4.3% |
| French | 97.3 /100 | #85 | Exceptional 4.3% |
| Ethiopians | 97.2 /100 | #86 | Exceptional 4.3% |
| Sudanese | 97.0 /100 | #87 | Exceptional 4.3% |
| Immigrants | Turkey | 96.9 /100 | #88 | Exceptional 4.3% |
| Immigrants | Argentina | 96.9 /100 | #89 | Exceptional 4.3% |
| Asians | 96.8 /100 | #90 | Exceptional 4.3% |
| Ukrainians | 96.6 /100 | #91 | Exceptional 4.3% |
| Mongolians | 96.6 /100 | #92 | Exceptional 4.3% |
| Argentineans | 96.5 /100 | #93 | Exceptional 4.3% |
| Immigrants | Malaysia | 96.2 /100 | #94 | Exceptional 4.4% |
| Immigrants | Ethiopia | 96.1 /100 | #95 | Exceptional 4.4% |
| Indonesians | 95.4 /100 | #96 | Exceptional 4.4% |
| Immigrants | Canada | 95.0 /100 | #97 | Exceptional 4.4% |
| Romanians | 94.9 /100 | #98 | Exceptional 4.4% |
| Immigrants | Burma/Myanmar | 94.9 /100 | #99 | Exceptional 4.4% |