French vs Immigrants from Albania Unemployment Among Ages 20 to 24 years
COMPARE
French
Immigrants from Albania
Unemployment Among Ages 20 to 24 years
Unemployment Among Ages 20 to 24 years Comparison
French
Immigrants from Albania
10.1%
UNEMPLOYMENT AMONG AGES 20 TO 24 YEARS
88.2/ 100
METRIC RATING
119th/ 347
METRIC RANK
10.8%
UNEMPLOYMENT AMONG AGES 20 TO 24 YEARS
0.7/ 100
METRIC RATING
247th/ 347
METRIC RANK
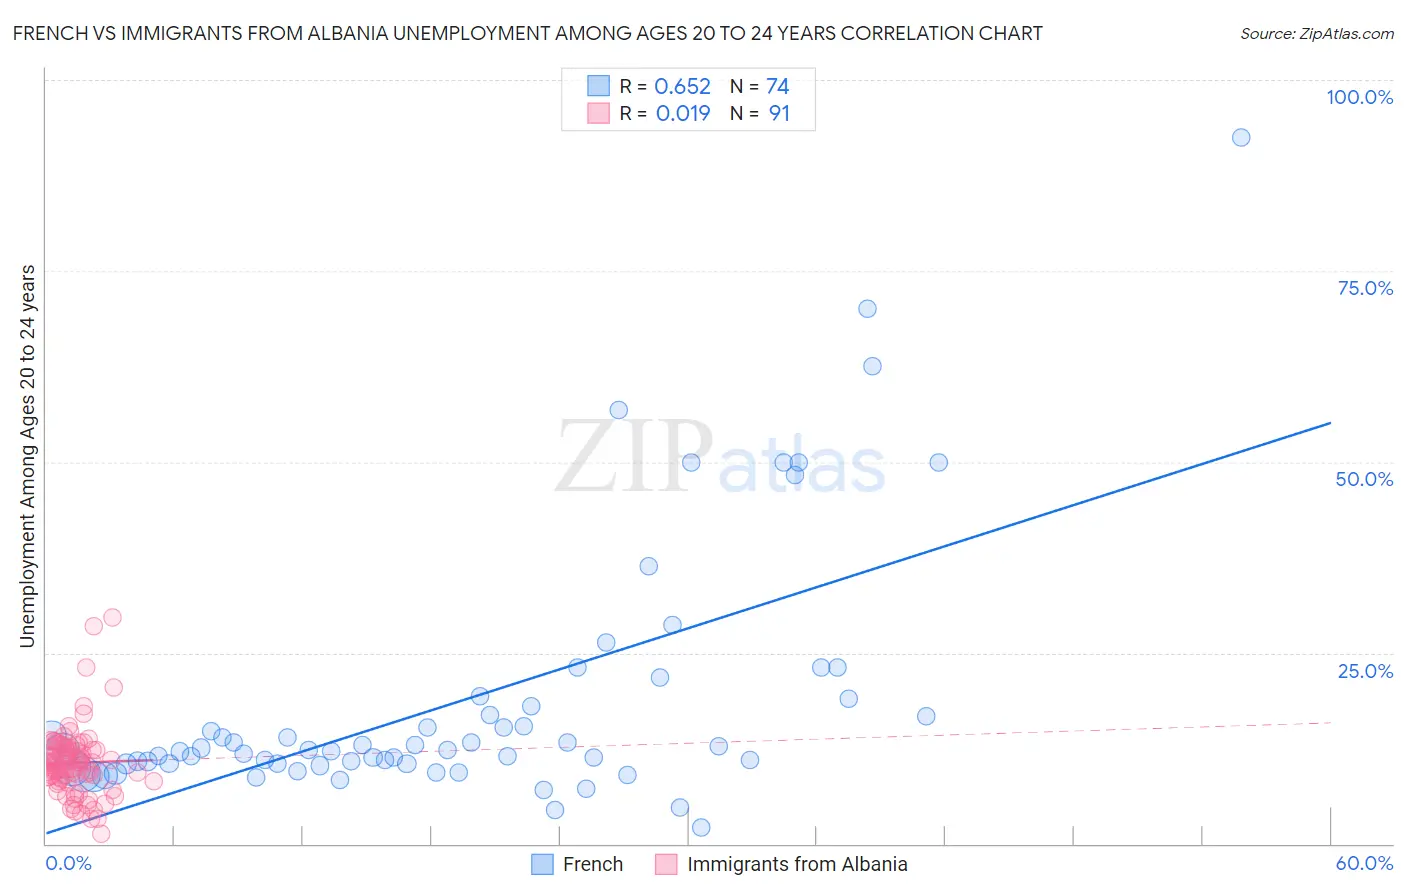
French vs Immigrants from Albania Unemployment Among Ages 20 to 24 years Correlation Chart
The statistical analysis conducted on geographies consisting of 523,708,435 people shows a significant positive correlation between the proportion of French and unemployment rate among population between the ages 20 and 24 in the United States with a correlation coefficient (R) of 0.652 and weighted average of 10.1%. Similarly, the statistical analysis conducted on geographies consisting of 117,834,163 people shows no correlation between the proportion of Immigrants from Albania and unemployment rate among population between the ages 20 and 24 in the United States with a correlation coefficient (R) of 0.019 and weighted average of 10.8%, a difference of 6.5%.
Unemployment Among Ages 20 to 24 years Correlation Summary
| Measurement | French | Immigrants from Albania |
| Minimum | 2.1% | 1.3% |
| Maximum | 92.5% | 29.6% |
| Range | 90.4% | 28.3% |
| Mean | 18.6% | 10.6% |
| Median | 12.2% | 10.6% |
| Interquartile 25% (IQ1) | 10.5% | 8.5% |
| Interquartile 75% (IQ3) | 18.0% | 12.6% |
| Interquartile Range (IQR) | 7.6% | 4.2% |
| Standard Deviation (Sample) | 16.7% | 4.5% |
| Standard Deviation (Population) | 16.6% | 4.5% |
Similar Demographics by Unemployment Among Ages 20 to 24 years
Demographics Similar to French by Unemployment Among Ages 20 to 24 years
In terms of unemployment among ages 20 to 24 years, the demographic groups most similar to French are Immigrants from Canada (10.1%, a difference of 0.0%), Paraguayan (10.1%, a difference of 0.030%), South African (10.1%, a difference of 0.040%), White/Caucasian (10.1%, a difference of 0.080%), and Immigrants from Iraq (10.1%, a difference of 0.10%).
| Demographics | Rating | Rank | Unemployment Among Ages 20 to 24 years |
| Northern Europeans | 92.7 /100 | #112 | Exceptional 10.1% |
| German Russians | 92.4 /100 | #113 | Exceptional 10.1% |
| Ottawa | 90.8 /100 | #114 | Exceptional 10.1% |
| Immigrants | Morocco | 90.5 /100 | #115 | Exceptional 10.1% |
| Basques | 89.8 /100 | #116 | Excellent 10.1% |
| Immigrants | Uruguay | 89.6 /100 | #117 | Excellent 10.1% |
| Paraguayans | 88.6 /100 | #118 | Excellent 10.1% |
| French | 88.2 /100 | #119 | Excellent 10.1% |
| Immigrants | Canada | 88.2 /100 | #120 | Excellent 10.1% |
| South Africans | 87.8 /100 | #121 | Excellent 10.1% |
| Whites/Caucasians | 87.4 /100 | #122 | Excellent 10.1% |
| Immigrants | Iraq | 87.1 /100 | #123 | Excellent 10.1% |
| Immigrants | Japan | 86.5 /100 | #124 | Excellent 10.1% |
| Spanish | 86.1 /100 | #125 | Excellent 10.1% |
| Jordanians | 86.1 /100 | #126 | Excellent 10.1% |
Demographics Similar to Immigrants from Albania by Unemployment Among Ages 20 to 24 years
In terms of unemployment among ages 20 to 24 years, the demographic groups most similar to Immigrants from Albania are Cree (10.8%, a difference of 0.10%), Immigrants from Iran (10.8%, a difference of 0.20%), South American Indian (10.8%, a difference of 0.29%), Albanian (10.8%, a difference of 0.33%), and Hispanic or Latino (10.7%, a difference of 0.34%).
| Demographics | Rating | Rank | Unemployment Among Ages 20 to 24 years |
| Immigrants | Central America | 2.0 /100 | #240 | Tragic 10.7% |
| Immigrants | El Salvador | 1.7 /100 | #241 | Tragic 10.7% |
| Moroccans | 1.4 /100 | #242 | Tragic 10.7% |
| Immigrants | Belarus | 1.3 /100 | #243 | Tragic 10.7% |
| Immigrants | Mexico | 1.2 /100 | #244 | Tragic 10.7% |
| Hispanics or Latinos | 1.0 /100 | #245 | Tragic 10.7% |
| Immigrants | Iran | 0.9 /100 | #246 | Tragic 10.8% |
| Immigrants | Albania | 0.7 /100 | #247 | Tragic 10.8% |
| Cree | 0.6 /100 | #248 | Tragic 10.8% |
| South American Indians | 0.5 /100 | #249 | Tragic 10.8% |
| Albanians | 0.5 /100 | #250 | Tragic 10.8% |
| Immigrants | Panama | 0.4 /100 | #251 | Tragic 10.8% |
| Immigrants | Syria | 0.4 /100 | #252 | Tragic 10.8% |
| Spanish Americans | 0.4 /100 | #253 | Tragic 10.8% |
| Liberians | 0.3 /100 | #254 | Tragic 10.8% |