Serbian vs Immigrants from Albania Unemployment Among Ages 20 to 24 years
COMPARE
Serbian
Immigrants from Albania
Unemployment Among Ages 20 to 24 years
Unemployment Among Ages 20 to 24 years Comparison
Serbians
Immigrants from Albania
9.8%
UNEMPLOYMENT AMONG AGES 20 TO 24 YEARS
99.4/ 100
METRIC RATING
64th/ 347
METRIC RANK
10.8%
UNEMPLOYMENT AMONG AGES 20 TO 24 YEARS
0.7/ 100
METRIC RATING
247th/ 347
METRIC RANK
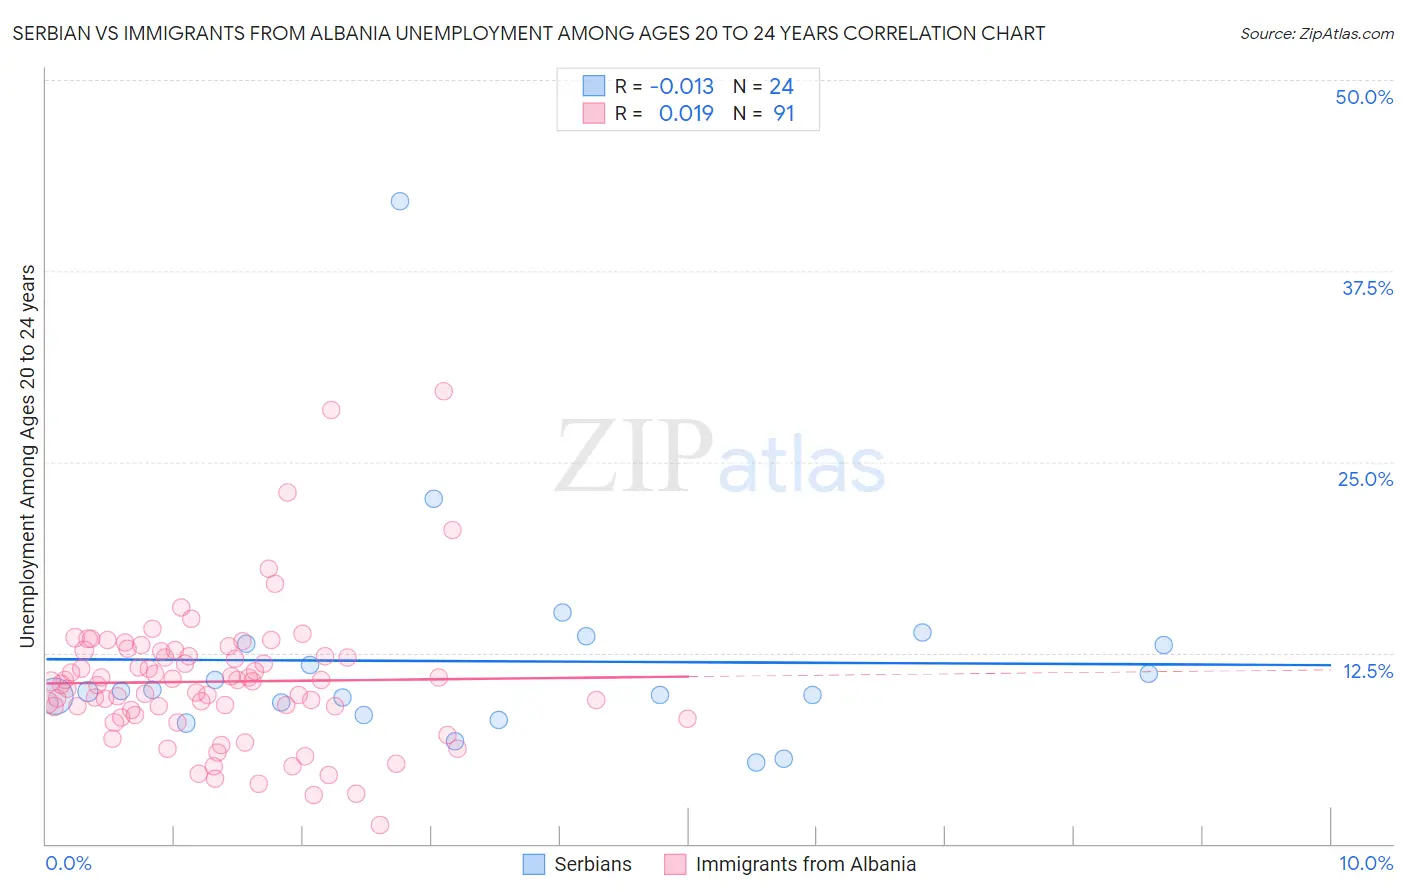
Serbian vs Immigrants from Albania Unemployment Among Ages 20 to 24 years Correlation Chart
The statistical analysis conducted on geographies consisting of 260,911,532 people shows no correlation between the proportion of Serbians and unemployment rate among population between the ages 20 and 24 in the United States with a correlation coefficient (R) of -0.013 and weighted average of 9.8%. Similarly, the statistical analysis conducted on geographies consisting of 117,834,163 people shows no correlation between the proportion of Immigrants from Albania and unemployment rate among population between the ages 20 and 24 in the United States with a correlation coefficient (R) of 0.019 and weighted average of 10.8%, a difference of 9.7%.
Unemployment Among Ages 20 to 24 years Correlation Summary
| Measurement | Serbian | Immigrants from Albania |
| Minimum | 5.3% | 1.3% |
| Maximum | 42.0% | 29.6% |
| Range | 36.7% | 28.3% |
| Mean | 11.9% | 10.6% |
| Median | 10.0% | 10.6% |
| Interquartile 25% (IQ1) | 8.8% | 8.5% |
| Interquartile 75% (IQ3) | 13.1% | 12.6% |
| Interquartile Range (IQR) | 4.2% | 4.2% |
| Standard Deviation (Sample) | 7.3% | 4.5% |
| Standard Deviation (Population) | 7.2% | 4.5% |
Similar Demographics by Unemployment Among Ages 20 to 24 years
Demographics Similar to Serbians by Unemployment Among Ages 20 to 24 years
In terms of unemployment among ages 20 to 24 years, the demographic groups most similar to Serbians are British (9.8%, a difference of 0.0%), Immigrants from Singapore (9.8%, a difference of 0.010%), Welsh (9.8%, a difference of 0.070%), Malaysian (9.8%, a difference of 0.11%), and Immigrants from Kuwait (9.8%, a difference of 0.13%).
| Demographics | Rating | Rank | Unemployment Among Ages 20 to 24 years |
| Immigrants | Moldova | 99.5 /100 | #57 | Exceptional 9.8% |
| Pakistanis | 99.5 /100 | #58 | Exceptional 9.8% |
| English | 99.5 /100 | #59 | Exceptional 9.8% |
| Immigrants | Kuwait | 99.5 /100 | #60 | Exceptional 9.8% |
| Malaysians | 99.5 /100 | #61 | Exceptional 9.8% |
| Immigrants | Singapore | 99.4 /100 | #62 | Exceptional 9.8% |
| British | 99.4 /100 | #63 | Exceptional 9.8% |
| Serbians | 99.4 /100 | #64 | Exceptional 9.8% |
| Welsh | 99.3 /100 | #65 | Exceptional 9.8% |
| Scottish | 99.3 /100 | #66 | Exceptional 9.8% |
| Immigrants | Bolivia | 99.2 /100 | #67 | Exceptional 9.9% |
| Mongolians | 99.1 /100 | #68 | Exceptional 9.9% |
| Bulgarians | 99.1 /100 | #69 | Exceptional 9.9% |
| Immigrants | Croatia | 99.0 /100 | #70 | Exceptional 9.9% |
| Celtics | 98.9 /100 | #71 | Exceptional 9.9% |
Demographics Similar to Immigrants from Albania by Unemployment Among Ages 20 to 24 years
In terms of unemployment among ages 20 to 24 years, the demographic groups most similar to Immigrants from Albania are Cree (10.8%, a difference of 0.10%), Immigrants from Iran (10.8%, a difference of 0.20%), South American Indian (10.8%, a difference of 0.29%), Albanian (10.8%, a difference of 0.33%), and Hispanic or Latino (10.7%, a difference of 0.34%).
| Demographics | Rating | Rank | Unemployment Among Ages 20 to 24 years |
| Immigrants | Central America | 2.0 /100 | #240 | Tragic 10.7% |
| Immigrants | El Salvador | 1.7 /100 | #241 | Tragic 10.7% |
| Moroccans | 1.4 /100 | #242 | Tragic 10.7% |
| Immigrants | Belarus | 1.3 /100 | #243 | Tragic 10.7% |
| Immigrants | Mexico | 1.2 /100 | #244 | Tragic 10.7% |
| Hispanics or Latinos | 1.0 /100 | #245 | Tragic 10.7% |
| Immigrants | Iran | 0.9 /100 | #246 | Tragic 10.8% |
| Immigrants | Albania | 0.7 /100 | #247 | Tragic 10.8% |
| Cree | 0.6 /100 | #248 | Tragic 10.8% |
| South American Indians | 0.5 /100 | #249 | Tragic 10.8% |
| Albanians | 0.5 /100 | #250 | Tragic 10.8% |
| Immigrants | Panama | 0.4 /100 | #251 | Tragic 10.8% |
| Immigrants | Syria | 0.4 /100 | #252 | Tragic 10.8% |
| Spanish Americans | 0.4 /100 | #253 | Tragic 10.8% |
| Liberians | 0.3 /100 | #254 | Tragic 10.8% |