French vs Comanche Unemployment Among Ages 20 to 24 years
COMPARE
French
Comanche
Unemployment Among Ages 20 to 24 years
Unemployment Among Ages 20 to 24 years Comparison
French
Comanche
10.1%
UNEMPLOYMENT AMONG AGES 20 TO 24 YEARS
88.2/ 100
METRIC RATING
119th/ 347
METRIC RANK
10.2%
UNEMPLOYMENT AMONG AGES 20 TO 24 YEARS
83.4/ 100
METRIC RATING
135th/ 347
METRIC RANK
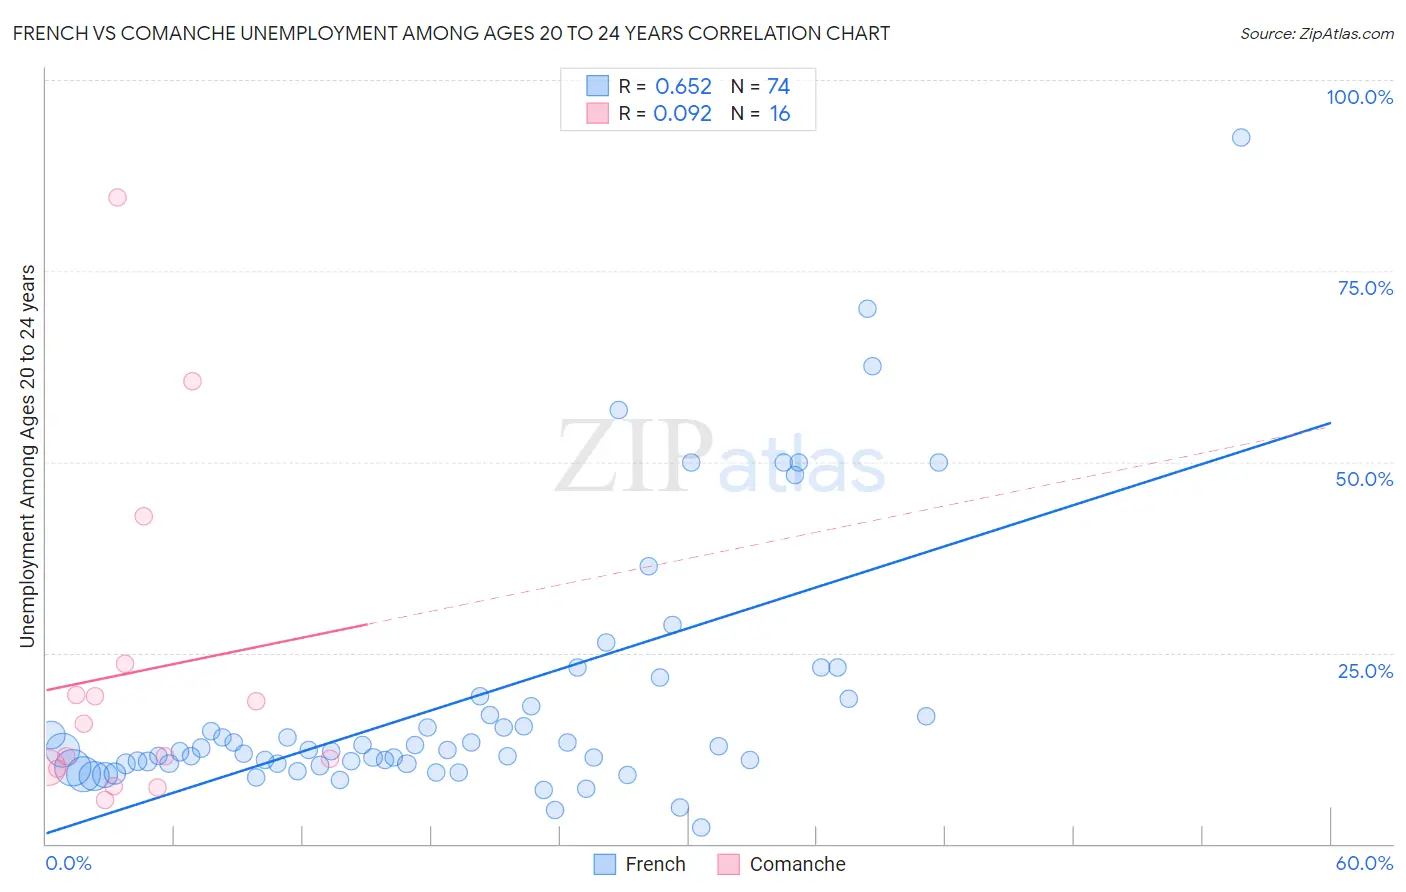
French vs Comanche Unemployment Among Ages 20 to 24 years Correlation Chart
The statistical analysis conducted on geographies consisting of 523,708,435 people shows a significant positive correlation between the proportion of French and unemployment rate among population between the ages 20 and 24 in the United States with a correlation coefficient (R) of 0.652 and weighted average of 10.1%. Similarly, the statistical analysis conducted on geographies consisting of 108,076,031 people shows a slight positive correlation between the proportion of Comanche and unemployment rate among population between the ages 20 and 24 in the United States with a correlation coefficient (R) of 0.092 and weighted average of 10.2%, a difference of 0.38%.
Unemployment Among Ages 20 to 24 years Correlation Summary
| Measurement | French | Comanche |
| Minimum | 2.1% | 5.8% |
| Maximum | 92.5% | 84.6% |
| Range | 90.4% | 78.9% |
| Mean | 18.6% | 22.4% |
| Median | 12.2% | 13.6% |
| Interquartile 25% (IQ1) | 10.5% | 9.9% |
| Interquartile 75% (IQ3) | 18.0% | 21.5% |
| Interquartile Range (IQR) | 7.6% | 11.6% |
| Standard Deviation (Sample) | 16.7% | 21.9% |
| Standard Deviation (Population) | 16.6% | 21.3% |
Demographics Similar to French and Comanche by Unemployment Among Ages 20 to 24 years
In terms of unemployment among ages 20 to 24 years, the demographic groups most similar to French are Immigrants from Canada (10.1%, a difference of 0.0%), Paraguayan (10.1%, a difference of 0.030%), South African (10.1%, a difference of 0.040%), White/Caucasian (10.1%, a difference of 0.080%), and Immigrants from Iraq (10.1%, a difference of 0.10%). Similarly, the demographic groups most similar to Comanche are Romanian (10.2%, a difference of 0.030%), Austrian (10.2%, a difference of 0.040%), Seminole (10.1%, a difference of 0.050%), Immigrants from South Eastern Asia (10.1%, a difference of 0.050%), and Immigrants from Lithuania (10.1%, a difference of 0.060%).
| Demographics | Rating | Rank | Unemployment Among Ages 20 to 24 years |
| Immigrants | Uruguay | 89.6 /100 | #117 | Excellent 10.1% |
| Paraguayans | 88.6 /100 | #118 | Excellent 10.1% |
| French | 88.2 /100 | #119 | Excellent 10.1% |
| Immigrants | Canada | 88.2 /100 | #120 | Excellent 10.1% |
| South Africans | 87.8 /100 | #121 | Excellent 10.1% |
| Whites/Caucasians | 87.4 /100 | #122 | Excellent 10.1% |
| Immigrants | Iraq | 87.1 /100 | #123 | Excellent 10.1% |
| Immigrants | Japan | 86.5 /100 | #124 | Excellent 10.1% |
| Spanish | 86.1 /100 | #125 | Excellent 10.1% |
| Jordanians | 86.1 /100 | #126 | Excellent 10.1% |
| Immigrants | Norway | 85.3 /100 | #127 | Excellent 10.1% |
| Immigrants | Brazil | 84.9 /100 | #128 | Excellent 10.1% |
| Immigrants | South Central Asia | 84.6 /100 | #129 | Excellent 10.1% |
| Immigrants | Lithuania | 84.2 /100 | #130 | Excellent 10.1% |
| Seminole | 84.2 /100 | #131 | Excellent 10.1% |
| Immigrants | South Eastern Asia | 84.0 /100 | #132 | Excellent 10.1% |
| Austrians | 83.9 /100 | #133 | Excellent 10.2% |
| Romanians | 83.8 /100 | #134 | Excellent 10.2% |
| Comanche | 83.4 /100 | #135 | Excellent 10.2% |
| Immigrants | Northern Africa | 82.5 /100 | #136 | Excellent 10.2% |
| Immigrants | North America | 82.5 /100 | #137 | Excellent 10.2% |