French American Indian vs Belizean Unemployment Among Seniors over 75 years
COMPARE
French American Indian
Belizean
Unemployment Among Seniors over 75 years
Unemployment Among Seniors over 75 years Comparison
French American Indians
Belizeans
8.2%
UNEMPLOYMENT AMONG SENIORS OVER 75 YEARS
98.7/ 100
METRIC RATING
111th/ 347
METRIC RANK
8.4%
UNEMPLOYMENT AMONG SENIORS OVER 75 YEARS
96.3/ 100
METRIC RATING
126th/ 347
METRIC RANK
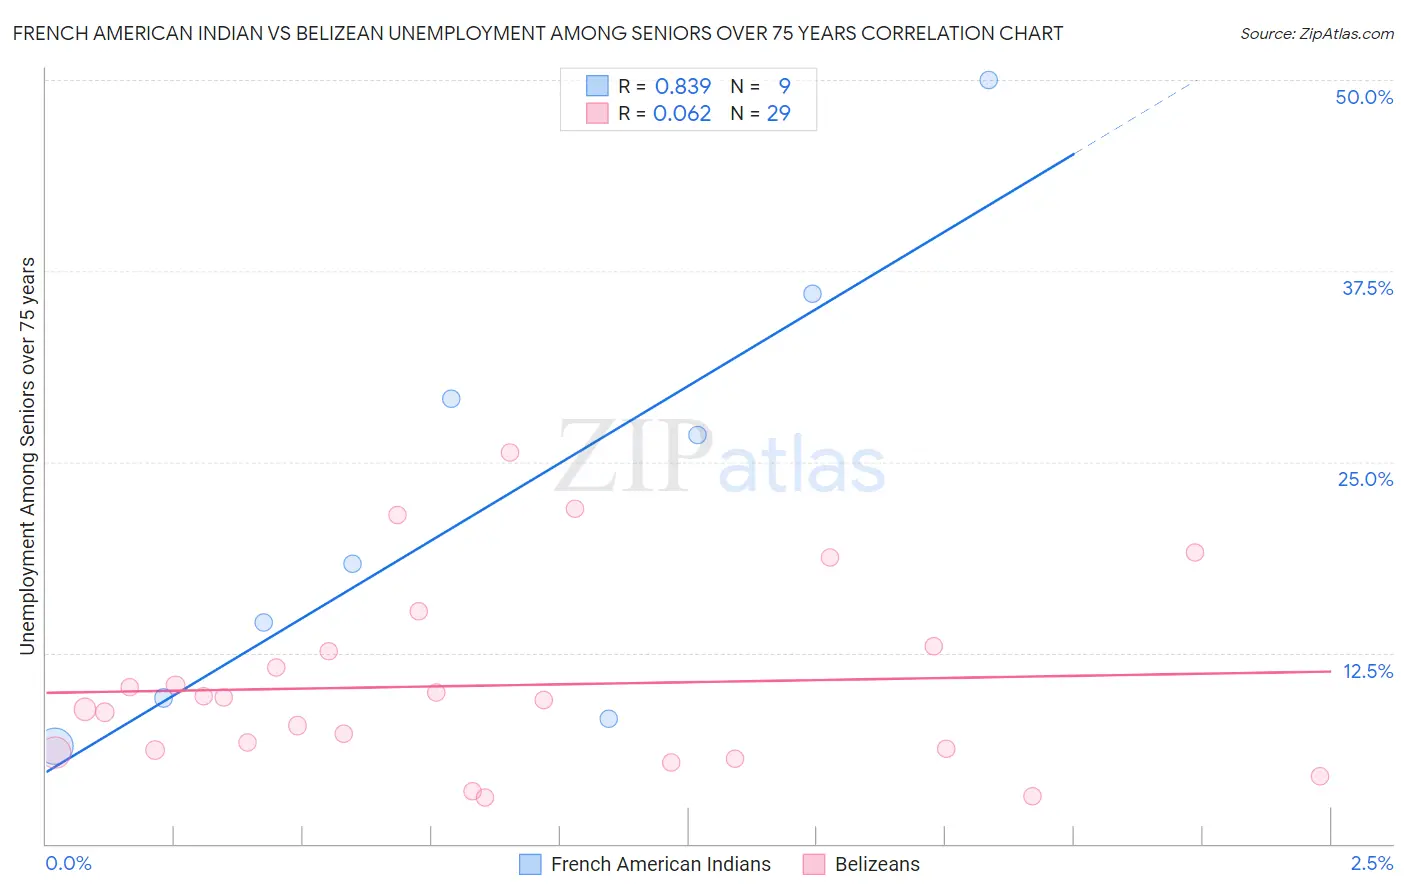
French American Indian vs Belizean Unemployment Among Seniors over 75 years Correlation Chart
The statistical analysis conducted on geographies consisting of 91,479,852 people shows a very strong positive correlation between the proportion of French American Indians and unemployment rate among seniors over the age of 75 in the United States with a correlation coefficient (R) of 0.839 and weighted average of 8.2%. Similarly, the statistical analysis conducted on geographies consisting of 103,352,649 people shows a slight positive correlation between the proportion of Belizeans and unemployment rate among seniors over the age of 75 in the United States with a correlation coefficient (R) of 0.062 and weighted average of 8.4%, a difference of 1.5%.
Unemployment Among Seniors over 75 years Correlation Summary
| Measurement | French American Indian | Belizean |
| Minimum | 6.4% | 3.0% |
| Maximum | 50.0% | 25.6% |
| Range | 43.6% | 22.6% |
| Mean | 22.1% | 10.4% |
| Median | 18.3% | 9.4% |
| Interquartile 25% (IQ1) | 8.8% | 6.0% |
| Interquartile 75% (IQ3) | 32.6% | 12.8% |
| Interquartile Range (IQR) | 23.8% | 6.7% |
| Standard Deviation (Sample) | 14.6% | 6.0% |
| Standard Deviation (Population) | 13.8% | 5.9% |
Demographics Similar to French American Indians and Belizeans by Unemployment Among Seniors over 75 years
In terms of unemployment among seniors over 75 years, the demographic groups most similar to French American Indians are Marshallese (8.2%, a difference of 0.050%), Immigrants from Lebanon (8.2%, a difference of 0.070%), Laotian (8.2%, a difference of 0.10%), Immigrants from India (8.2%, a difference of 0.13%), and Asian (8.3%, a difference of 0.18%). Similarly, the demographic groups most similar to Belizeans are Honduran (8.4%, a difference of 0.010%), Native Hawaiian (8.4%, a difference of 0.050%), Immigrants from Moldova (8.3%, a difference of 0.20%), Thai (8.3%, a difference of 0.22%), and Immigrants from Nepal (8.3%, a difference of 0.27%).
| Demographics | Rating | Rank | Unemployment Among Seniors over 75 years |
| Laotians | 98.8 /100 | #108 | Exceptional 8.2% |
| Immigrants | Lebanon | 98.8 /100 | #109 | Exceptional 8.2% |
| Marshallese | 98.7 /100 | #110 | Exceptional 8.2% |
| French American Indians | 98.7 /100 | #111 | Exceptional 8.2% |
| Immigrants | India | 98.6 /100 | #112 | Exceptional 8.2% |
| Asians | 98.5 /100 | #113 | Exceptional 8.3% |
| Trinidadians and Tobagonians | 98.4 /100 | #114 | Exceptional 8.3% |
| Sudanese | 98.2 /100 | #115 | Exceptional 8.3% |
| Immigrants | West Indies | 98.1 /100 | #116 | Exceptional 8.3% |
| Immigrants | Greece | 97.9 /100 | #117 | Exceptional 8.3% |
| Immigrants | Middle Africa | 97.9 /100 | #118 | Exceptional 8.3% |
| Japanese | 97.5 /100 | #119 | Exceptional 8.3% |
| Immigrants | Asia | 97.4 /100 | #120 | Exceptional 8.3% |
| Immigrants | Croatia | 97.2 /100 | #121 | Exceptional 8.3% |
| Immigrants | Russia | 97.1 /100 | #122 | Exceptional 8.3% |
| Immigrants | Nepal | 96.9 /100 | #123 | Exceptional 8.3% |
| Thais | 96.8 /100 | #124 | Exceptional 8.3% |
| Immigrants | Moldova | 96.7 /100 | #125 | Exceptional 8.3% |
| Belizeans | 96.3 /100 | #126 | Exceptional 8.4% |
| Hondurans | 96.2 /100 | #127 | Exceptional 8.4% |
| Native Hawaiians | 96.1 /100 | #128 | Exceptional 8.4% |