French American Indian vs Puerto Rican Male Unemployment
COMPARE
French American Indian
Puerto Rican
Male Unemployment
Male Unemployment Comparison
French American Indians
Puerto Ricans
5.9%
MALE UNEMPLOYMENT
0.0/ 100
METRIC RATING
265th/ 347
METRIC RANK
8.6%
MALE UNEMPLOYMENT
0.0/ 100
METRIC RATING
337th/ 347
METRIC RANK
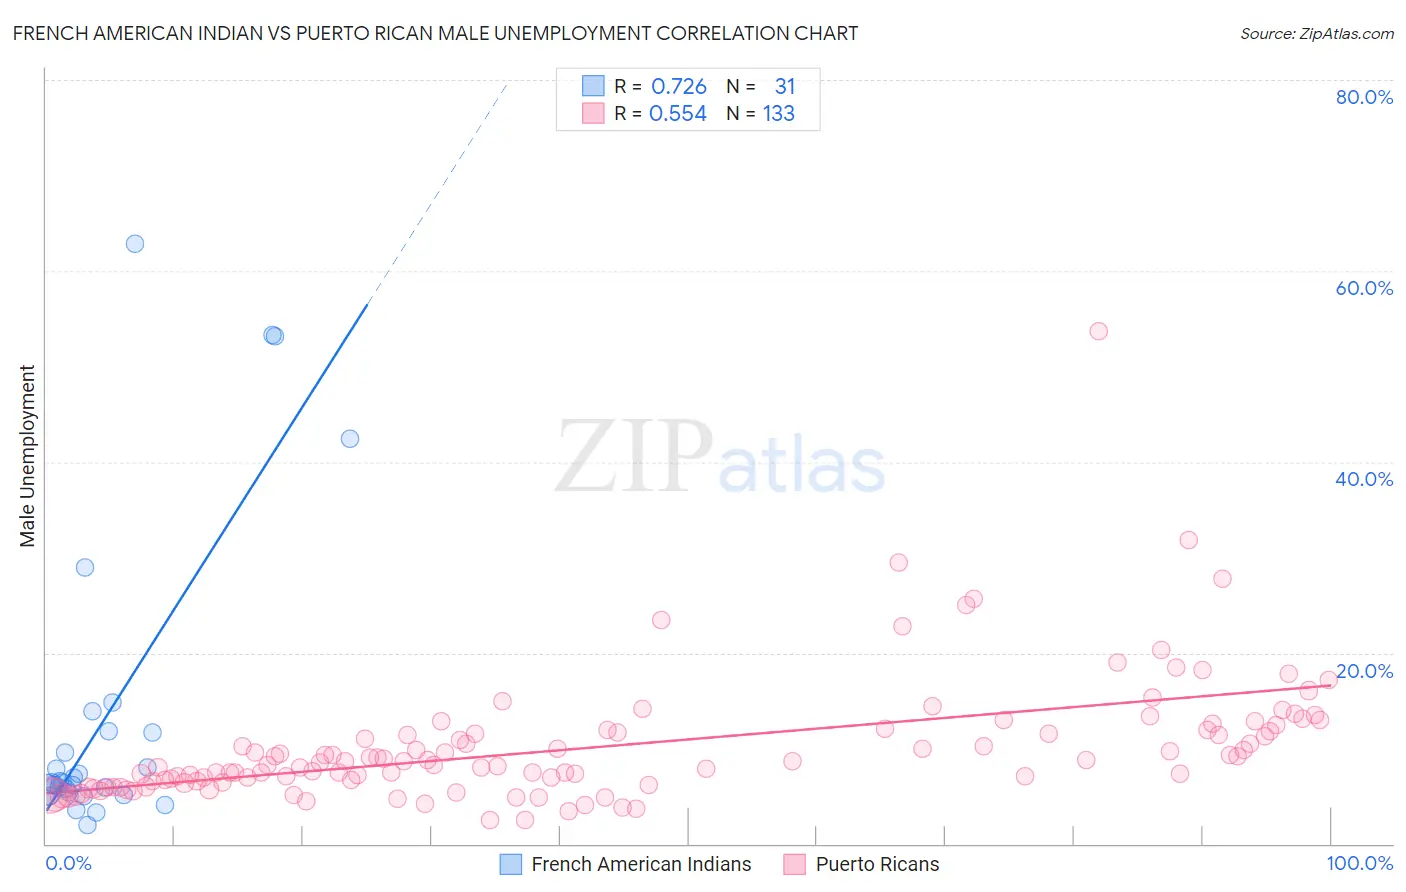
French American Indian vs Puerto Rican Male Unemployment Correlation Chart
The statistical analysis conducted on geographies consisting of 131,648,620 people shows a strong positive correlation between the proportion of French American Indians and unemployment rate among males in the United States with a correlation coefficient (R) of 0.726 and weighted average of 5.9%. Similarly, the statistical analysis conducted on geographies consisting of 523,207,266 people shows a substantial positive correlation between the proportion of Puerto Ricans and unemployment rate among males in the United States with a correlation coefficient (R) of 0.554 and weighted average of 8.6%, a difference of 45.4%.
Male Unemployment Correlation Summary
| Measurement | French American Indian | Puerto Rican |
| Minimum | 1.9% | 2.5% |
| Maximum | 62.9% | 53.7% |
| Range | 61.0% | 51.2% |
| Mean | 13.6% | 10.2% |
| Median | 6.4% | 8.6% |
| Interquartile 25% (IQ1) | 5.4% | 6.5% |
| Interquartile 75% (IQ3) | 11.8% | 11.8% |
| Interquartile Range (IQR) | 6.4% | 5.4% |
| Standard Deviation (Sample) | 16.4% | 6.6% |
| Standard Deviation (Population) | 16.1% | 6.5% |
Similar Demographics by Male Unemployment
Demographics Similar to French American Indians by Male Unemployment
In terms of male unemployment, the demographic groups most similar to French American Indians are Bahamian (5.9%, a difference of 0.14%), Nigerian (5.9%, a difference of 0.26%), Immigrants from Mexico (5.9%, a difference of 0.39%), Bermudan (5.9%, a difference of 0.47%), and Immigrants from Latin America (5.9%, a difference of 0.61%).
| Demographics | Rating | Rank | Male Unemployment |
| Dutch West Indians | 0.1 /100 | #258 | Tragic 5.8% |
| Cajuns | 0.1 /100 | #259 | Tragic 5.8% |
| Immigrants | Central America | 0.1 /100 | #260 | Tragic 5.8% |
| Liberians | 0.1 /100 | #261 | Tragic 5.8% |
| Immigrants | Portugal | 0.1 /100 | #262 | Tragic 5.9% |
| Immigrants | Latin America | 0.1 /100 | #263 | Tragic 5.9% |
| Immigrants | Mexico | 0.0 /100 | #264 | Tragic 5.9% |
| French American Indians | 0.0 /100 | #265 | Tragic 5.9% |
| Bahamians | 0.0 /100 | #266 | Tragic 5.9% |
| Nigerians | 0.0 /100 | #267 | Tragic 5.9% |
| Bermudans | 0.0 /100 | #268 | Tragic 5.9% |
| Immigrants | Nigeria | 0.0 /100 | #269 | Tragic 6.0% |
| Sub-Saharan Africans | 0.0 /100 | #270 | Tragic 6.0% |
| Blackfeet | 0.0 /100 | #271 | Tragic 6.0% |
| Immigrants | Uzbekistan | 0.0 /100 | #272 | Tragic 6.0% |
Demographics Similar to Puerto Ricans by Male Unemployment
In terms of male unemployment, the demographic groups most similar to Puerto Ricans are Yuman (8.6%, a difference of 0.080%), Apache (8.6%, a difference of 0.15%), Pueblo (8.5%, a difference of 1.4%), Tsimshian (8.5%, a difference of 1.5%), and Sioux (8.4%, a difference of 2.5%).
| Demographics | Rating | Rank | Male Unemployment |
| Yakama | 0.0 /100 | #330 | Tragic 7.9% |
| Alaska Natives | 0.0 /100 | #331 | Tragic 8.1% |
| Pima | 0.0 /100 | #332 | Tragic 8.3% |
| Sioux | 0.0 /100 | #333 | Tragic 8.4% |
| Tsimshian | 0.0 /100 | #334 | Tragic 8.5% |
| Pueblo | 0.0 /100 | #335 | Tragic 8.5% |
| Yuman | 0.0 /100 | #336 | Tragic 8.6% |
| Puerto Ricans | 0.0 /100 | #337 | Tragic 8.6% |
| Apache | 0.0 /100 | #338 | Tragic 8.6% |
| Cheyenne | 0.0 /100 | #339 | Tragic 9.8% |
| Alaskan Athabascans | 0.0 /100 | #340 | Tragic 9.8% |
| Navajo | 0.0 /100 | #341 | Tragic 9.8% |
| Tohono O'odham | 0.0 /100 | #342 | Tragic 10.2% |
| Crow | 0.0 /100 | #343 | Tragic 10.6% |
| Hopi | 0.0 /100 | #344 | Tragic 10.8% |