Ute vs Cambodian Unemployment Among Seniors over 75 years
COMPARE
Ute
Cambodian
Unemployment Among Seniors over 75 years
Unemployment Among Seniors over 75 years Comparison
Ute
Cambodians
6.8%
UNEMPLOYMENT AMONG SENIORS OVER 75 YEARS
100.0/ 100
METRIC RATING
14th/ 347
METRIC RANK
7.6%
UNEMPLOYMENT AMONG SENIORS OVER 75 YEARS
100.0/ 100
METRIC RATING
33rd/ 347
METRIC RANK
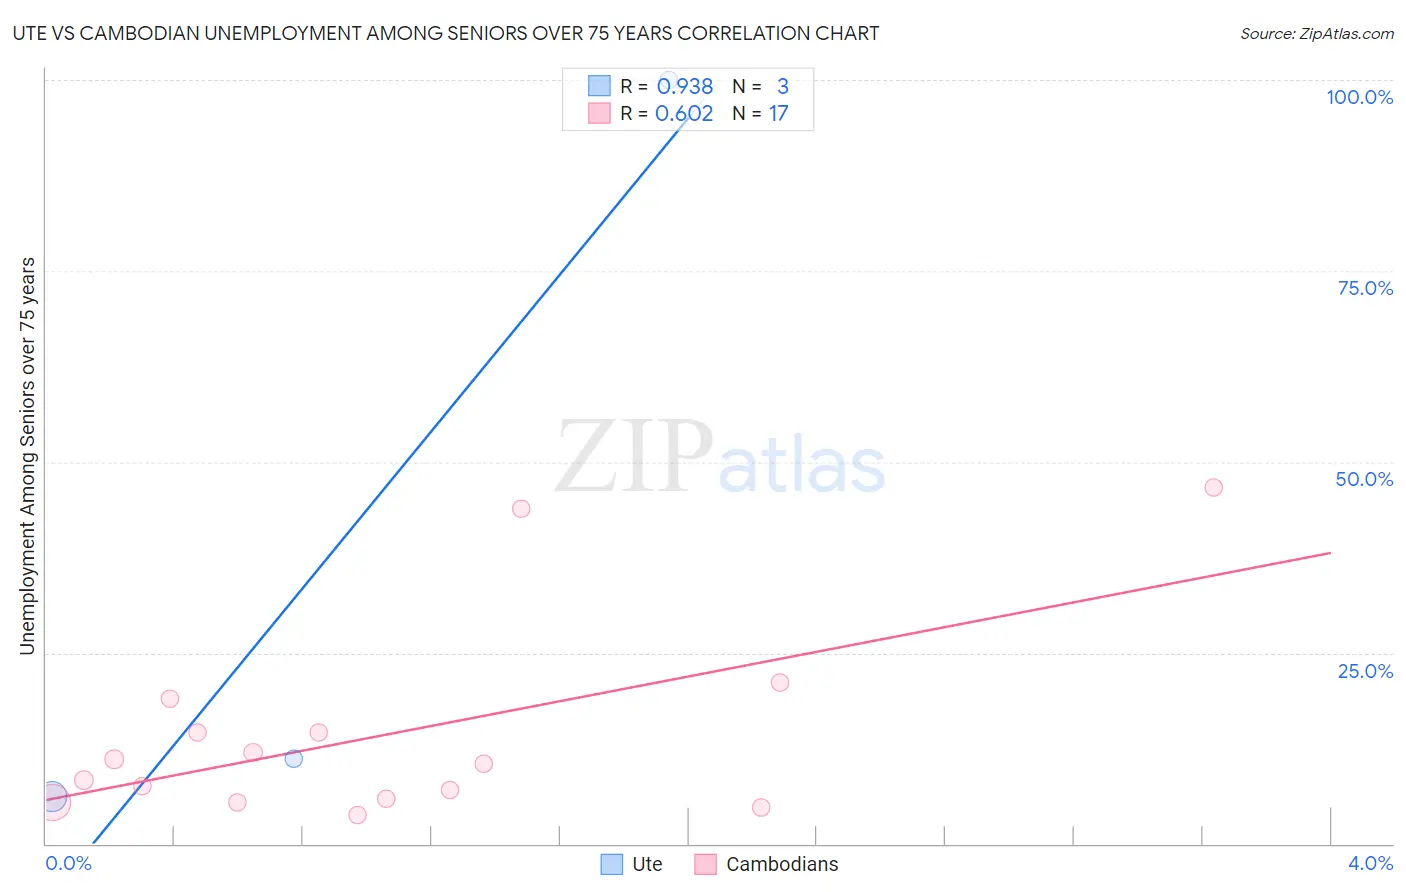
Ute vs Cambodian Unemployment Among Seniors over 75 years Correlation Chart
The statistical analysis conducted on geographies consisting of 45,076,650 people shows a near-perfect positive correlation between the proportion of Ute and unemployment rate among seniors over the age of 75 in the United States with a correlation coefficient (R) of 0.938 and weighted average of 6.8%. Similarly, the statistical analysis conducted on geographies consisting of 78,067,296 people shows a significant positive correlation between the proportion of Cambodians and unemployment rate among seniors over the age of 75 in the United States with a correlation coefficient (R) of 0.602 and weighted average of 7.6%, a difference of 12.4%.
Unemployment Among Seniors over 75 years Correlation Summary
| Measurement | Ute | Cambodian |
| Minimum | 6.2% | 3.8% |
| Maximum | 100.0% | 46.7% |
| Range | 93.8% | 42.9% |
| Mean | 39.1% | 14.2% |
| Median | 11.1% | 10.5% |
| Interquartile 25% (IQ1) | 6.2% | 5.7% |
| Interquartile 75% (IQ3) | 100.0% | 16.8% |
| Interquartile Range (IQR) | 93.8% | 11.1% |
| Standard Deviation (Sample) | 52.8% | 12.7% |
| Standard Deviation (Population) | 43.1% | 12.3% |
Demographics Similar to Ute and Cambodians by Unemployment Among Seniors over 75 years
In terms of unemployment among seniors over 75 years, the demographic groups most similar to Ute are Immigrants from Congo (6.7%, a difference of 1.1%), Icelander (7.0%, a difference of 3.3%), Seminole (7.1%, a difference of 4.6%), Immigrants from Switzerland (7.2%, a difference of 5.7%), and Immigrants from Uzbekistan (7.2%, a difference of 6.0%). Similarly, the demographic groups most similar to Cambodians are Immigrants from Hong Kong (7.6%, a difference of 0.010%), Guyanese (7.6%, a difference of 0.51%), Immigrants from Sweden (7.6%, a difference of 0.89%), Immigrants from Iran (7.6%, a difference of 1.0%), and Immigrants from Israel (7.6%, a difference of 1.0%).
| Demographics | Rating | Rank | Unemployment Among Seniors over 75 years |
| Immigrants | Congo | 100.0 /100 | #13 | Exceptional 6.7% |
| Ute | 100.0 /100 | #14 | Exceptional 6.8% |
| Icelanders | 100.0 /100 | #15 | Exceptional 7.0% |
| Seminole | 100.0 /100 | #16 | Exceptional 7.1% |
| Immigrants | Switzerland | 100.0 /100 | #17 | Exceptional 7.2% |
| Immigrants | Uzbekistan | 100.0 /100 | #18 | Exceptional 7.2% |
| Immigrants | Zaire | 100.0 /100 | #19 | Exceptional 7.2% |
| Armenians | 100.0 /100 | #20 | Exceptional 7.2% |
| Chickasaw | 100.0 /100 | #21 | Exceptional 7.3% |
| Cypriots | 100.0 /100 | #22 | Exceptional 7.4% |
| Israelis | 100.0 /100 | #23 | Exceptional 7.4% |
| Immigrants | Cuba | 100.0 /100 | #24 | Exceptional 7.4% |
| Immigrants | Uruguay | 100.0 /100 | #25 | Exceptional 7.5% |
| South Africans | 100.0 /100 | #26 | Exceptional 7.5% |
| Immigrants | Barbados | 100.0 /100 | #27 | Exceptional 7.6% |
| Immigrants | Israel | 100.0 /100 | #28 | Exceptional 7.6% |
| Immigrants | Iran | 100.0 /100 | #29 | Exceptional 7.6% |
| Immigrants | Sweden | 100.0 /100 | #30 | Exceptional 7.6% |
| Guyanese | 100.0 /100 | #31 | Exceptional 7.6% |
| Immigrants | Hong Kong | 100.0 /100 | #32 | Exceptional 7.6% |
| Cambodians | 100.0 /100 | #33 | Exceptional 7.6% |