Bangladeshi vs Ukrainian Male Unemployment
COMPARE
Bangladeshi
Ukrainian
Male Unemployment
Male Unemployment Comparison
Bangladeshis
Ukrainians
5.7%
MALE UNEMPLOYMENT
0.8/ 100
METRIC RATING
243rd/ 347
METRIC RANK
5.1%
MALE UNEMPLOYMENT
88.4/ 100
METRIC RATING
120th/ 347
METRIC RANK
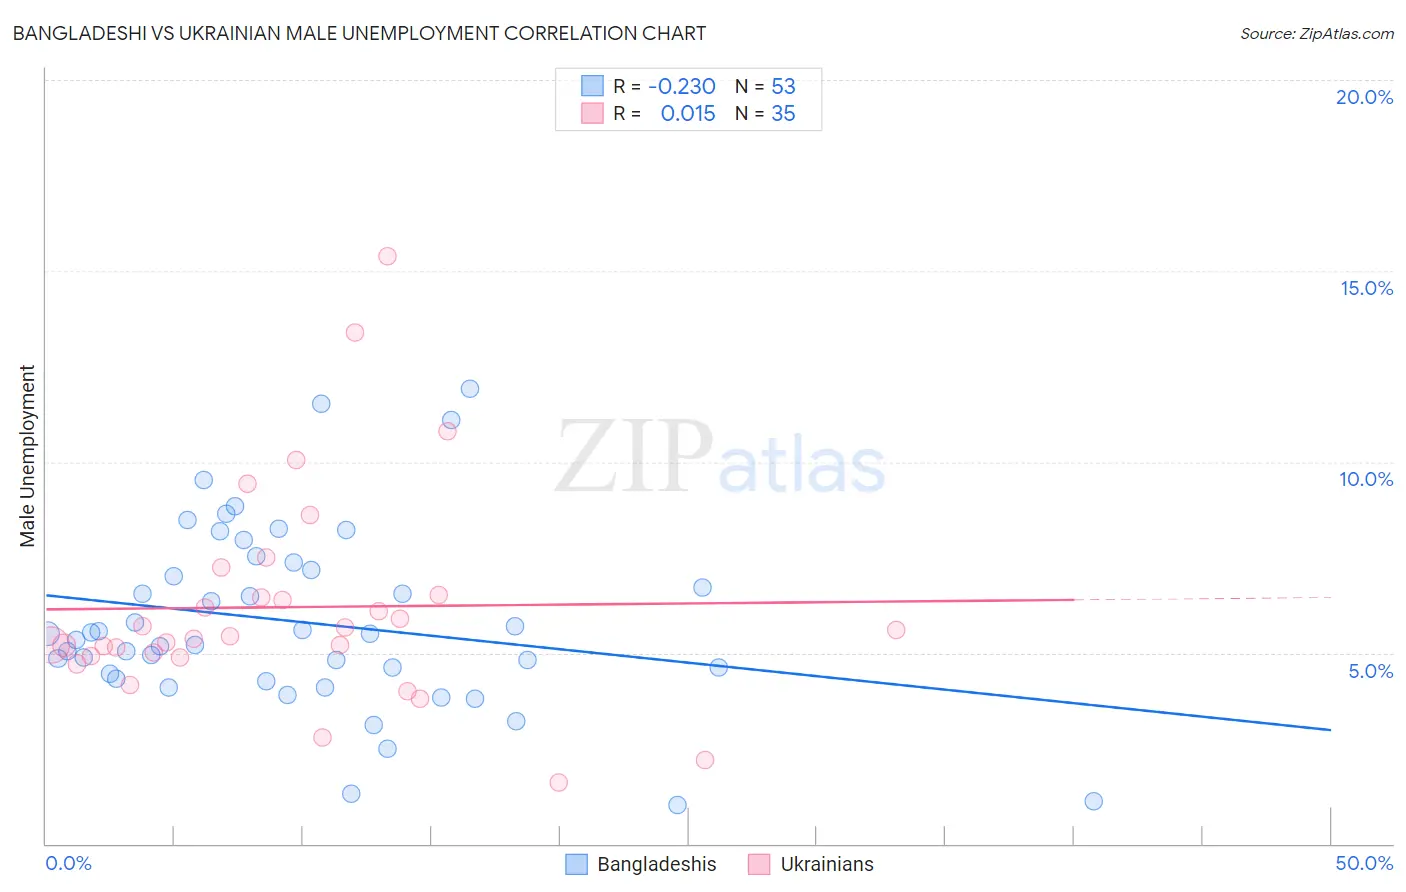
Bangladeshi vs Ukrainian Male Unemployment Correlation Chart
The statistical analysis conducted on geographies consisting of 141,111,800 people shows a weak negative correlation between the proportion of Bangladeshis and unemployment rate among males in the United States with a correlation coefficient (R) of -0.230 and weighted average of 5.7%. Similarly, the statistical analysis conducted on geographies consisting of 445,622,080 people shows no correlation between the proportion of Ukrainians and unemployment rate among males in the United States with a correlation coefficient (R) of 0.015 and weighted average of 5.1%, a difference of 10.4%.
Male Unemployment Correlation Summary
| Measurement | Bangladeshi | Ukrainian |
| Minimum | 1.0% | 1.6% |
| Maximum | 11.9% | 15.4% |
| Range | 10.9% | 13.8% |
| Mean | 5.8% | 6.2% |
| Median | 5.5% | 5.4% |
| Interquartile 25% (IQ1) | 4.4% | 4.9% |
| Interquartile 75% (IQ3) | 7.3% | 6.5% |
| Interquartile Range (IQR) | 2.9% | 1.6% |
| Standard Deviation (Sample) | 2.4% | 2.8% |
| Standard Deviation (Population) | 2.4% | 2.8% |
Similar Demographics by Male Unemployment
Demographics Similar to Bangladeshis by Male Unemployment
In terms of male unemployment, the demographic groups most similar to Bangladeshis are Immigrants from El Salvador (5.7%, a difference of 0.050%), Yaqui (5.7%, a difference of 0.21%), Ottawa (5.7%, a difference of 0.28%), Iroquois (5.7%, a difference of 0.30%), and Salvadoran (5.7%, a difference of 0.35%).
| Demographics | Rating | Rank | Male Unemployment |
| Guatemalans | 1.2 /100 | #236 | Tragic 5.6% |
| Hondurans | 1.1 /100 | #237 | Tragic 5.6% |
| Native Hawaiians | 1.1 /100 | #238 | Tragic 5.6% |
| Immigrants | Guatemala | 1.1 /100 | #239 | Tragic 5.6% |
| Immigrants | Cameroon | 1.0 /100 | #240 | Tragic 5.6% |
| Salvadorans | 1.0 /100 | #241 | Tragic 5.7% |
| Ottawa | 0.9 /100 | #242 | Tragic 5.7% |
| Bangladeshis | 0.8 /100 | #243 | Tragic 5.7% |
| Immigrants | El Salvador | 0.7 /100 | #244 | Tragic 5.7% |
| Yaqui | 0.7 /100 | #245 | Tragic 5.7% |
| Iroquois | 0.6 /100 | #246 | Tragic 5.7% |
| Hawaiians | 0.6 /100 | #247 | Tragic 5.7% |
| Marshallese | 0.5 /100 | #248 | Tragic 5.7% |
| Cree | 0.4 /100 | #249 | Tragic 5.7% |
| Immigrants | Bahamas | 0.4 /100 | #250 | Tragic 5.7% |
Demographics Similar to Ukrainians by Male Unemployment
In terms of male unemployment, the demographic groups most similar to Ukrainians are Mongolian (5.1%, a difference of 0.010%), French Canadian (5.1%, a difference of 0.020%), Nicaraguan (5.1%, a difference of 0.040%), Cypriot (5.1%, a difference of 0.060%), and Estonian (5.1%, a difference of 0.090%).
| Demographics | Rating | Rank | Male Unemployment |
| Immigrants | Austria | 90.3 /100 | #113 | Exceptional 5.1% |
| Romanians | 89.8 /100 | #114 | Excellent 5.1% |
| Immigrants | Asia | 89.6 /100 | #115 | Excellent 5.1% |
| Immigrants | Denmark | 89.4 /100 | #116 | Excellent 5.1% |
| Estonians | 89.0 /100 | #117 | Excellent 5.1% |
| Cypriots | 88.8 /100 | #118 | Excellent 5.1% |
| French Canadians | 88.6 /100 | #119 | Excellent 5.1% |
| Ukrainians | 88.4 /100 | #120 | Excellent 5.1% |
| Mongolians | 88.4 /100 | #121 | Excellent 5.1% |
| Nicaraguans | 88.2 /100 | #122 | Excellent 5.1% |
| Palestinians | 87.7 /100 | #123 | Excellent 5.1% |
| Immigrants | Latvia | 87.5 /100 | #124 | Excellent 5.1% |
| Immigrants | Lithuania | 87.2 /100 | #125 | Excellent 5.1% |
| Immigrants | Colombia | 86.8 /100 | #126 | Excellent 5.1% |
| Immigrants | Brazil | 86.3 /100 | #127 | Excellent 5.2% |