Ethiopian vs Peruvian Unemployment Among Ages 65 to 74 years
COMPARE
Ethiopian
Peruvian
Unemployment Among Ages 65 to 74 years
Unemployment Among Ages 65 to 74 years Comparison
Ethiopians
Peruvians
5.0%
UNEMPLOYMENT AMONG AGES 65 TO 74 YEARS
100.0/ 100
METRIC RATING
29th/ 347
METRIC RANK
5.5%
UNEMPLOYMENT AMONG AGES 65 TO 74 YEARS
2.2/ 100
METRIC RATING
235th/ 347
METRIC RANK
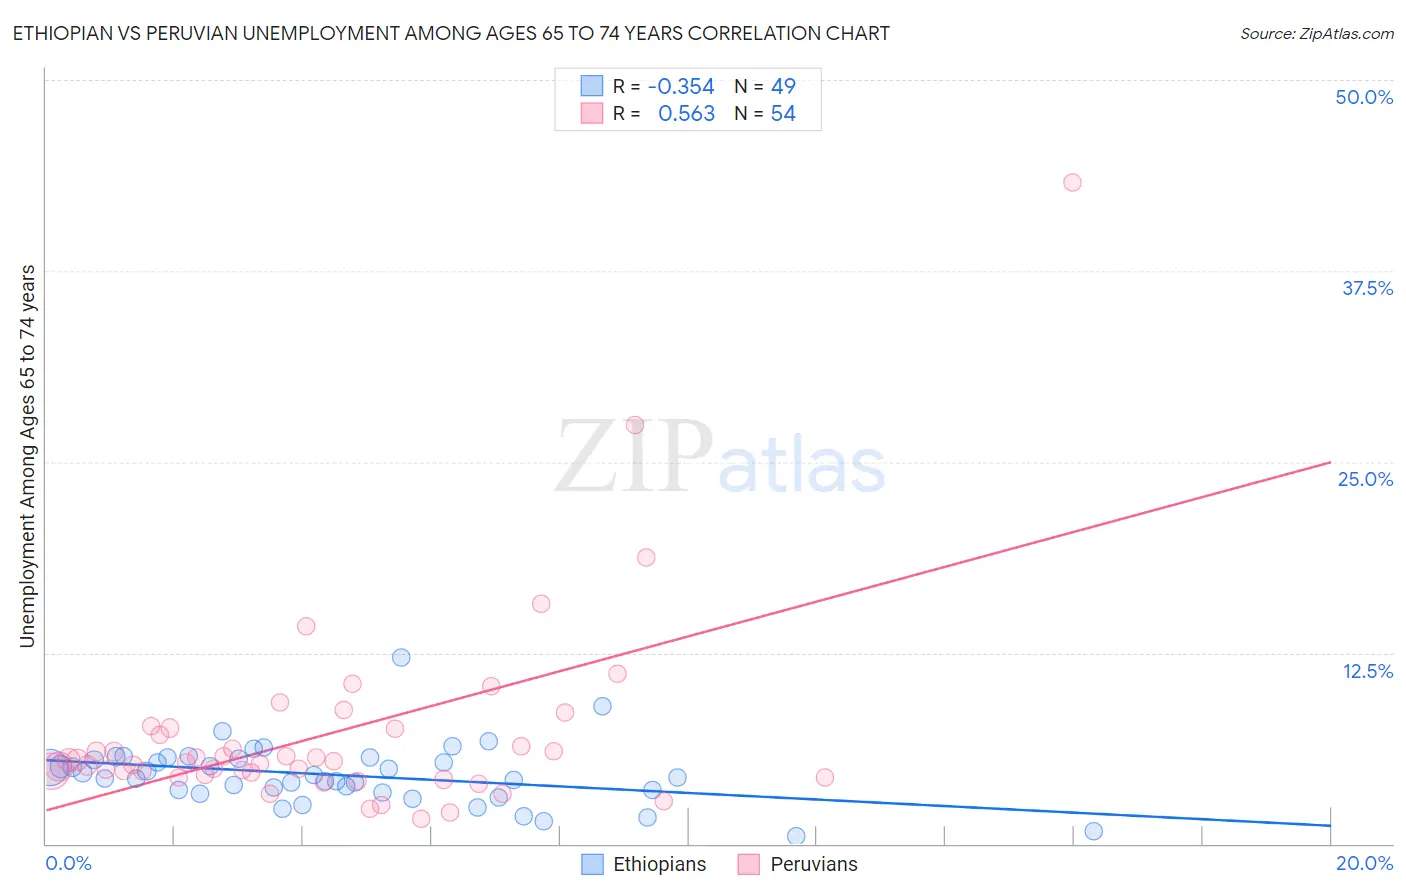
Ethiopian vs Peruvian Unemployment Among Ages 65 to 74 years Correlation Chart
The statistical analysis conducted on geographies consisting of 206,778,623 people shows a mild negative correlation between the proportion of Ethiopians and unemployment rate among population between the ages 65 and 74 in the United States with a correlation coefficient (R) of -0.354 and weighted average of 5.0%. Similarly, the statistical analysis conducted on geographies consisting of 326,935,718 people shows a substantial positive correlation between the proportion of Peruvians and unemployment rate among population between the ages 65 and 74 in the United States with a correlation coefficient (R) of 0.563 and weighted average of 5.5%, a difference of 10.9%.
Unemployment Among Ages 65 to 74 years Correlation Summary
| Measurement | Ethiopian | Peruvian |
| Minimum | 0.50% | 1.6% |
| Maximum | 12.2% | 43.3% |
| Range | 11.7% | 41.7% |
| Mean | 4.5% | 7.2% |
| Median | 4.4% | 5.3% |
| Interquartile 25% (IQ1) | 3.4% | 4.5% |
| Interquartile 75% (IQ3) | 5.6% | 7.6% |
| Interquartile Range (IQR) | 2.1% | 3.1% |
| Standard Deviation (Sample) | 2.0% | 6.6% |
| Standard Deviation (Population) | 2.0% | 6.6% |
Similar Demographics by Unemployment Among Ages 65 to 74 years
Demographics Similar to Ethiopians by Unemployment Among Ages 65 to 74 years
In terms of unemployment among ages 65 to 74 years, the demographic groups most similar to Ethiopians are Immigrants from Lebanon (5.0%, a difference of 0.090%), Slovene (5.0%, a difference of 0.19%), Bulgarian (5.0%, a difference of 0.45%), Palestinian (5.0%, a difference of 0.47%), and Belgian (5.0%, a difference of 0.52%).
| Demographics | Rating | Rank | Unemployment Among Ages 65 to 74 years |
| Lebanese | 100.0 /100 | #22 | Exceptional 4.9% |
| Immigrants | Nepal | 100.0 /100 | #23 | Exceptional 4.9% |
| Iraqis | 100.0 /100 | #24 | Exceptional 4.9% |
| Macedonians | 100.0 /100 | #25 | Exceptional 5.0% |
| Czechs | 100.0 /100 | #26 | Exceptional 5.0% |
| Norwegians | 100.0 /100 | #27 | Exceptional 5.0% |
| Bulgarians | 100.0 /100 | #28 | Exceptional 5.0% |
| Ethiopians | 100.0 /100 | #29 | Exceptional 5.0% |
| Immigrants | Lebanon | 100.0 /100 | #30 | Exceptional 5.0% |
| Slovenes | 100.0 /100 | #31 | Exceptional 5.0% |
| Palestinians | 100.0 /100 | #32 | Exceptional 5.0% |
| Belgians | 100.0 /100 | #33 | Exceptional 5.0% |
| Cambodians | 100.0 /100 | #34 | Exceptional 5.0% |
| Bhutanese | 100.0 /100 | #35 | Exceptional 5.0% |
| Immigrants | Kuwait | 99.9 /100 | #36 | Exceptional 5.0% |
Demographics Similar to Peruvians by Unemployment Among Ages 65 to 74 years
In terms of unemployment among ages 65 to 74 years, the demographic groups most similar to Peruvians are French American Indian (5.5%, a difference of 0.0%), Hopi (5.5%, a difference of 0.010%), Immigrants from Belize (5.5%, a difference of 0.010%), South American Indian (5.5%, a difference of 0.020%), and Nigerian (5.5%, a difference of 0.11%).
| Demographics | Rating | Rank | Unemployment Among Ages 65 to 74 years |
| Immigrants | Israel | 3.0 /100 | #228 | Tragic 5.5% |
| West Indians | 2.7 /100 | #229 | Tragic 5.5% |
| Immigrants | Caribbean | 2.7 /100 | #230 | Tragic 5.5% |
| Israelis | 2.5 /100 | #231 | Tragic 5.5% |
| Nigerians | 2.5 /100 | #232 | Tragic 5.5% |
| South American Indians | 2.3 /100 | #233 | Tragic 5.5% |
| French American Indians | 2.2 /100 | #234 | Tragic 5.5% |
| Peruvians | 2.2 /100 | #235 | Tragic 5.5% |
| Hopi | 2.2 /100 | #236 | Tragic 5.5% |
| Immigrants | Belize | 2.2 /100 | #237 | Tragic 5.5% |
| Cajuns | 1.8 /100 | #238 | Tragic 5.5% |
| German Russians | 1.6 /100 | #239 | Tragic 5.5% |
| Ghanaians | 1.4 /100 | #240 | Tragic 5.6% |
| Cree | 1.4 /100 | #241 | Tragic 5.6% |
| Immigrants | Ghana | 1.4 /100 | #242 | Tragic 5.6% |