Ethiopian vs Immigrants from Oceania Unemployment Among Women with Children Under 6 years
COMPARE
Ethiopian
Immigrants from Oceania
Unemployment Among Women with Children Under 6 years
Unemployment Among Women with Children Under 6 years Comparison
Ethiopians
Immigrants from Oceania
6.8%
UNEMPLOYMENT AMONG WOMEN WITH CHILDREN UNDER 6 YEARS
99.9/ 100
METRIC RATING
51st/ 347
METRIC RANK
7.5%
UNEMPLOYMENT AMONG WOMEN WITH CHILDREN UNDER 6 YEARS
78.4/ 100
METRIC RATING
147th/ 347
METRIC RANK
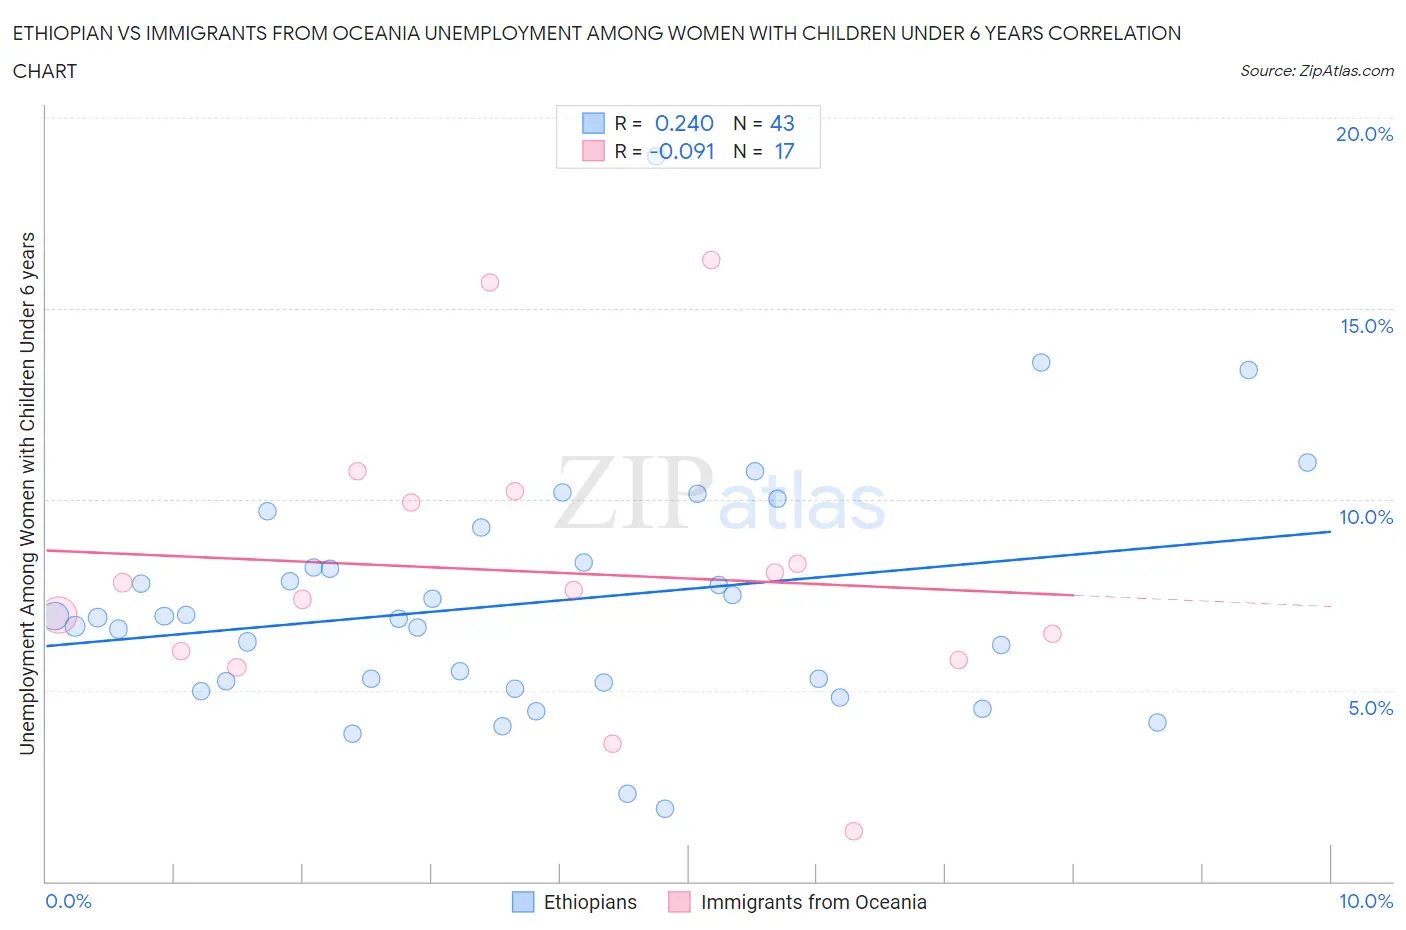
Ethiopian vs Immigrants from Oceania Unemployment Among Women with Children Under 6 years Correlation Chart
The statistical analysis conducted on geographies consisting of 190,123,801 people shows a weak positive correlation between the proportion of Ethiopians and unemployment rate among women with children under the age of 6 in the United States with a correlation coefficient (R) of 0.240 and weighted average of 6.8%. Similarly, the statistical analysis conducted on geographies consisting of 243,645,085 people shows a slight negative correlation between the proportion of Immigrants from Oceania and unemployment rate among women with children under the age of 6 in the United States with a correlation coefficient (R) of -0.091 and weighted average of 7.5%, a difference of 10.2%.
Unemployment Among Women with Children Under 6 years Correlation Summary
| Measurement | Ethiopian | Immigrants from Oceania |
| Minimum | 1.9% | 1.3% |
| Maximum | 19.0% | 16.3% |
| Range | 17.1% | 15.0% |
| Mean | 7.3% | 8.1% |
| Median | 6.9% | 7.6% |
| Interquartile 25% (IQ1) | 5.2% | 5.9% |
| Interquartile 75% (IQ3) | 8.4% | 10.1% |
| Interquartile Range (IQR) | 3.2% | 4.2% |
| Standard Deviation (Sample) | 3.2% | 3.8% |
| Standard Deviation (Population) | 3.1% | 3.7% |
Similar Demographics by Unemployment Among Women with Children Under 6 years
Demographics Similar to Ethiopians by Unemployment Among Women with Children Under 6 years
In terms of unemployment among women with children under 6 years, the demographic groups most similar to Ethiopians are Immigrants from Nepal (6.8%, a difference of 0.020%), Immigrants from Ireland (6.8%, a difference of 0.020%), Immigrants from Switzerland (6.8%, a difference of 0.080%), Immigrants from Asia (6.8%, a difference of 0.11%), and Immigrants from Iran (6.8%, a difference of 0.11%).
| Demographics | Rating | Rank | Unemployment Among Women with Children Under 6 years |
| Iranians | 99.9 /100 | #44 | Exceptional 6.7% |
| Immigrants | Australia | 99.9 /100 | #45 | Exceptional 6.8% |
| Latvians | 99.9 /100 | #46 | Exceptional 6.8% |
| Immigrants | Asia | 99.9 /100 | #47 | Exceptional 6.8% |
| Immigrants | Switzerland | 99.9 /100 | #48 | Exceptional 6.8% |
| Immigrants | Nepal | 99.9 /100 | #49 | Exceptional 6.8% |
| Immigrants | Ireland | 99.9 /100 | #50 | Exceptional 6.8% |
| Ethiopians | 99.9 /100 | #51 | Exceptional 6.8% |
| Immigrants | Iran | 99.9 /100 | #52 | Exceptional 6.8% |
| Chinese | 99.9 /100 | #53 | Exceptional 6.8% |
| Immigrants | Latvia | 99.9 /100 | #54 | Exceptional 6.8% |
| Immigrants | Ukraine | 99.8 /100 | #55 | Exceptional 6.8% |
| Immigrants | Ethiopia | 99.8 /100 | #56 | Exceptional 6.9% |
| Icelanders | 99.8 /100 | #57 | Exceptional 6.9% |
| Immigrants | Turkey | 99.8 /100 | #58 | Exceptional 6.9% |
Demographics Similar to Immigrants from Oceania by Unemployment Among Women with Children Under 6 years
In terms of unemployment among women with children under 6 years, the demographic groups most similar to Immigrants from Oceania are Immigrants from Jordan (7.5%, a difference of 0.050%), Japanese (7.5%, a difference of 0.050%), European (7.5%, a difference of 0.070%), Immigrants from Brazil (7.5%, a difference of 0.11%), and Colombian (7.5%, a difference of 0.22%).
| Demographics | Rating | Rank | Unemployment Among Women with Children Under 6 years |
| Scandinavians | 83.0 /100 | #140 | Excellent 7.4% |
| Greeks | 82.6 /100 | #141 | Excellent 7.4% |
| Immigrants | Argentina | 81.5 /100 | #142 | Excellent 7.5% |
| Koreans | 81.3 /100 | #143 | Excellent 7.5% |
| Europeans | 79.1 /100 | #144 | Good 7.5% |
| Immigrants | Jordan | 78.9 /100 | #145 | Good 7.5% |
| Japanese | 78.9 /100 | #146 | Good 7.5% |
| Immigrants | Oceania | 78.4 /100 | #147 | Good 7.5% |
| Immigrants | Brazil | 77.3 /100 | #148 | Good 7.5% |
| Colombians | 76.1 /100 | #149 | Good 7.5% |
| Aleuts | 76.0 /100 | #150 | Good 7.5% |
| Immigrants | Peru | 74.9 /100 | #151 | Good 7.5% |
| Bangladeshis | 74.8 /100 | #152 | Good 7.5% |
| Uruguayans | 74.7 /100 | #153 | Good 7.5% |
| Northern Europeans | 74.3 /100 | #154 | Good 7.5% |