Estonian vs Immigrants from Malaysia Unemployment Among Women with Children Under 18 years
COMPARE
Estonian
Immigrants from Malaysia
Unemployment Among Women with Children Under 18 years
Unemployment Among Women with Children Under 18 years Comparison
Estonians
Immigrants from Malaysia
5.1%
UNEMPLOYMENT AMONG WOMEN WITH CHILDREN UNDER 18 YEARS
97.2/ 100
METRIC RATING
64th/ 347
METRIC RANK
5.0%
UNEMPLOYMENT AMONG WOMEN WITH CHILDREN UNDER 18 YEARS
98.8/ 100
METRIC RATING
45th/ 347
METRIC RANK
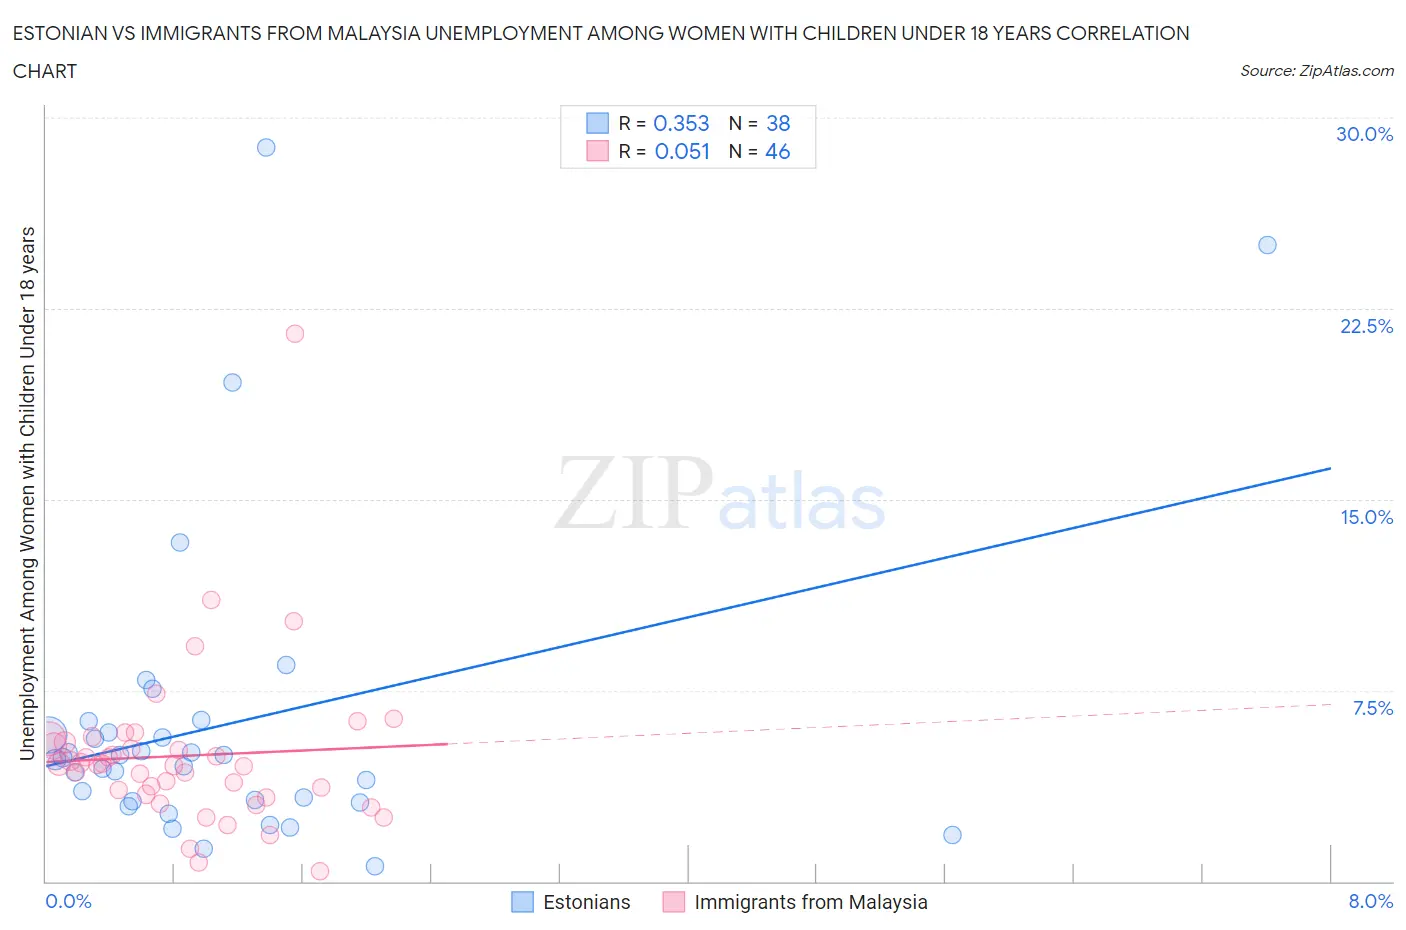
Estonian vs Immigrants from Malaysia Unemployment Among Women with Children Under 18 years Correlation Chart
The statistical analysis conducted on geographies consisting of 121,191,816 people shows a mild positive correlation between the proportion of Estonians and unemployment rate among women with children under the age of 18 in the United States with a correlation coefficient (R) of 0.353 and weighted average of 5.1%. Similarly, the statistical analysis conducted on geographies consisting of 194,871,803 people shows a slight positive correlation between the proportion of Immigrants from Malaysia and unemployment rate among women with children under the age of 18 in the United States with a correlation coefficient (R) of 0.051 and weighted average of 5.0%, a difference of 1.7%.
Unemployment Among Women with Children Under 18 years Correlation Summary
| Measurement | Estonian | Immigrants from Malaysia |
| Minimum | 0.60% | 0.40% |
| Maximum | 28.8% | 21.5% |
| Range | 28.2% | 21.1% |
| Mean | 6.2% | 4.9% |
| Median | 4.8% | 4.6% |
| Interquartile 25% (IQ1) | 3.2% | 3.4% |
| Interquartile 75% (IQ3) | 5.8% | 5.5% |
| Interquartile Range (IQR) | 2.7% | 2.1% |
| Standard Deviation (Sample) | 6.0% | 3.3% |
| Standard Deviation (Population) | 5.9% | 3.2% |
Demographics Similar to Estonians and Immigrants from Malaysia by Unemployment Among Women with Children Under 18 years
In terms of unemployment among women with children under 18 years, the demographic groups most similar to Estonians are Italian (5.1%, a difference of 0.17%), Immigrants from Bulgaria (5.1%, a difference of 0.19%), Russian (5.1%, a difference of 0.26%), Welsh (5.1%, a difference of 0.41%), and Asian (5.1%, a difference of 0.56%). Similarly, the demographic groups most similar to Immigrants from Malaysia are Immigrants from Moldova (5.0%, a difference of 0.080%), Immigrants from Korea (5.0%, a difference of 0.11%), British (5.0%, a difference of 0.24%), Northern European (5.0%, a difference of 0.37%), and Lithuanian (5.0%, a difference of 0.59%).
| Demographics | Rating | Rank | Unemployment Among Women with Children Under 18 years |
| Immigrants | Moldova | 98.9 /100 | #44 | Exceptional 5.0% |
| Immigrants | Malaysia | 98.8 /100 | #45 | Exceptional 5.0% |
| Immigrants | Korea | 98.7 /100 | #46 | Exceptional 5.0% |
| British | 98.7 /100 | #47 | Exceptional 5.0% |
| Northern Europeans | 98.6 /100 | #48 | Exceptional 5.0% |
| Lithuanians | 98.4 /100 | #49 | Exceptional 5.0% |
| Immigrants | Japan | 98.4 /100 | #50 | Exceptional 5.0% |
| Yugoslavians | 98.3 /100 | #51 | Exceptional 5.1% |
| Immigrants | Nepal | 98.3 /100 | #52 | Exceptional 5.1% |
| Scottish | 98.2 /100 | #53 | Exceptional 5.1% |
| Immigrants | Serbia | 98.2 /100 | #54 | Exceptional 5.1% |
| Immigrants | Sri Lanka | 98.1 /100 | #55 | Exceptional 5.1% |
| Immigrants | Ireland | 98.0 /100 | #56 | Exceptional 5.1% |
| Czechoslovakians | 98.0 /100 | #57 | Exceptional 5.1% |
| Immigrants | Belgium | 97.9 /100 | #58 | Exceptional 5.1% |
| Asians | 97.9 /100 | #59 | Exceptional 5.1% |
| Welsh | 97.7 /100 | #60 | Exceptional 5.1% |
| Russians | 97.5 /100 | #61 | Exceptional 5.1% |
| Immigrants | Bulgaria | 97.4 /100 | #62 | Exceptional 5.1% |
| Italians | 97.4 /100 | #63 | Exceptional 5.1% |
| Estonians | 97.2 /100 | #64 | Exceptional 5.1% |