Alsatian vs Immigrants from Cabo Verde Unemployment Among Seniors over 75 years

COMPARE

Alsatian
Race
Ancestry
AfghanAfricanAlaska NativeAlaskan AthabascanAlbanianAleutAlsatianAmericanApacheArabArapahoArgentineanArmenianAssyrian/Chaldean/SyriacAustralianAustrianBahamianBangladeshiBarbadianBasqueBelgianBelizeanBermudanBhutaneseBlackfeetBolivianBrazilianBritishBritish West IndianBulgarianBurmeseCajunCambodianCanadianCape VerdeanCarpatho RusynCelticCentral AmericanCentral American IndianCherokeeCheyenneChickasawChileanChineseChippewaChoctawColombianColvilleComancheCosta RicanCreeCreekCroatianCrowCubanCypriotCzechCzechoslovakianDanishDelawareDominicanDutchDutch West IndianEastern EuropeanEcuadorianEgyptianEnglishEstonianEthiopianEuropeanFijianFilipinoFinnishFrenchFrench American IndianFrench CanadianGermanGerman RussianGhanaianGreekGuamanian/ChamorroGuatemalanGuyaneseHaitianHmongHonduranHopiHoumaHungarianIcelanderIndian (Asian)IndonesianInupiatIranianIraqiIrishIroquoisIsraeliItalianJamaicanJapaneseJordanianKenyanKiowaKoreanLaotianLatvianLebaneseLiberianLithuanianLumbeeLuxembourgerMacedonianMalaysianMalteseMarshalleseMexicanMexican American IndianMongolianMoroccanNative HawaiianNavajoNepaleseNew ZealanderNicaraguanNigerianNorthern EuropeanNorwegianOkinawanOsageOttawaPaiutePakistaniPalestinianPanamanianParaguayanPennsylvania GermanPeruvianPimaPolishPortuguesePotawatomiPuebloPuerto RicanPuget Sound SalishRomanianRussianSalvadoranSamoanScandinavianScotch-IrishScottishSeminoleSenegaleseSerbianShoshoneSierra LeoneanSiouxSlavicSlovakSloveneSomaliSouth AfricanSouth AmericanSouth American IndianSoviet UnionSpaniardSpanishSpanish AmericanSpanish American IndianSri LankanSubsaharan AfricanSudaneseSwedishSwissSyrianTaiwaneseThaiTlingit-HaidaTohono O'OdhamTonganTrinidadian and TobagonianTsimshianTurkishU.S. Virgin IslanderUgandanUkrainianUruguayanUteVenezuelanVietnameseWelshWest IndianYakamaYaquiYugoslavianYumanYup'ikZimbabwean
Immigration
NonimmigrantsImmigrantsAfghanistanAfricaAlbaniaArgentinaArmeniaAsiaAustraliaAustriaBahamasBangladeshBarbadosBelarusBelgiumBelizeBoliviaBosnia and HerzegovinaBrazilBulgariaBurma/MyanmarCambodiaCameroonCanadaCaribbeanCentral AmericaChileChinaColombiaCongoCosta RicaCroatiaCubaCzechoslovakiaDenmarkDominicaDominican RepublicEastern AfricaEastern AsiaEastern EuropeEcuadorEgyptEl SalvadorEnglandEritreaEthiopiaEuropeFijiFranceGermanyGhanaGreeceGrenadaGuatemalaGuyanaHaitiHondurasHong KongHungaryIndiaIndonesiaIranIraqIrelandIsraelItalyJamaicaJapanJordanKazakhstanKenyaKoreaKuwaitLaosLatin AmericaLatviaLebanonLiberiaLithuaniaMalaysiaMexicoMicronesiaMiddle AfricaMoldovaMoroccoNepalNetherlandsNicaraguaNigeriaNorth AmericaNorth MacedoniaNorthern AfricaNorthern EuropeNorwayOceaniaPakistanPanamaPeruPhilippinesPolandPortugalRomaniaRussiaSaudi ArabiaScotlandSenegalSerbiaSierra LeoneSingaporeSomaliaSouth AfricaSouth AmericaSouth Central AsiaSouth Eastern AsiaSouthern EuropeSpainSri LankaSt. Vincent and the GrenadinesSudanSwedenSwitzerlandSyriaTaiwanThailandTrinidad and TobagoTurkeyUgandaUkraineUruguayUzbekistanVenezuelaVietnamWest IndiesWestern AfricaWestern AsiaWestern EuropeYemenZaireZimbabweAzores
Immigrants from Cabo Verde
Race
Ancestry
AfghanAfricanAlaska NativeAlaskan AthabascanAlbanianAleutAmericanApacheArabArapahoArgentineanArmenianAssyrian/Chaldean/SyriacAustralianAustrianBahamianBangladeshiBarbadianBasqueBelgianBelizeanBermudanBhutaneseBlackfeetBolivianBrazilianBritishBritish West IndianBulgarianBurmeseCajunCambodianCanadianCape VerdeanCarpatho RusynCelticCentral AmericanCentral American IndianCherokeeCheyenneChickasawChileanChineseChippewaChoctawColombianColvilleComancheCosta RicanCreeCreekCroatianCrowCubanCypriotCzechCzechoslovakianDanishDelawareDominicanDutchDutch West IndianEastern EuropeanEcuadorianEgyptianEnglishEstonianEthiopianEuropeanFijianFilipinoFinnishFrenchFrench American IndianFrench CanadianGermanGerman RussianGhanaianGreekGuamanian/ChamorroGuatemalanGuyaneseHaitianHmongHonduranHopiHoumaHungarianIcelanderIndian (Asian)IndonesianInupiatIranianIraqiIrishIroquoisIsraeliItalianJamaicanJapaneseJordanianKenyanKiowaKoreanLaotianLatvianLebaneseLiberianLithuanianLumbeeLuxembourgerMacedonianMalaysianMalteseMarshalleseMexicanMexican American IndianMongolianMoroccanNative HawaiianNavajoNepaleseNew ZealanderNicaraguanNigerianNorthern EuropeanNorwegianOkinawanOsageOttawaPaiutePakistaniPalestinianPanamanianParaguayanPennsylvania GermanPeruvianPimaPolishPortuguesePotawatomiPuebloPuerto RicanPuget Sound SalishRomanianRussianSalvadoranSamoanScandinavianScotch-IrishScottishSeminoleSenegaleseSerbianShoshoneSierra LeoneanSiouxSlavicSlovakSloveneSomaliSouth AfricanSouth AmericanSouth American IndianSoviet UnionSpaniardSpanishSpanish AmericanSpanish American IndianSri LankanSubsaharan AfricanSudaneseSwedishSwissSyrianTaiwaneseThaiTlingit-HaidaTohono O'OdhamTonganTrinidadian and TobagonianTsimshianTurkishU.S. Virgin IslanderUgandanUkrainianUruguayanUteVenezuelanVietnameseWelshWest IndianYakamaYaquiYugoslavianYumanYup'ikZimbabwean
Immigration
NonimmigrantsImmigrantsAfghanistanAfricaAlbaniaArgentinaArmeniaAsiaAustraliaAustriaBahamasBangladeshBarbadosBelarusBelgiumBelizeBoliviaBosnia and HerzegovinaBrazilBulgariaBurma/MyanmarCabo VerdeCambodiaCameroonCanadaCaribbeanCentral AmericaChileChinaColombiaCongoCosta RicaCroatiaCubaCzechoslovakiaDenmarkDominicaDominican RepublicEastern AfricaEastern AsiaEastern EuropeEcuadorEgyptEl SalvadorEnglandEritreaEthiopiaEuropeFijiFranceGermanyGhanaGreeceGrenadaGuatemalaGuyanaHaitiHondurasHong KongHungaryIndiaIndonesiaIranIraqIrelandIsraelItalyJamaicaJapanJordanKazakhstanKenyaKoreaKuwaitLaosLatin AmericaLatviaLebanonLiberiaLithuaniaMalaysiaMexicoMicronesiaMiddle AfricaMoldovaMoroccoNepalNetherlandsNicaraguaNigeriaNorth AmericaNorth MacedoniaNorthern AfricaNorthern EuropeNorwayOceaniaPakistanPanamaPeruPhilippinesPolandPortugalRomaniaRussiaSaudi ArabiaScotlandSenegalSerbiaSierra LeoneSingaporeSomaliaSouth AfricaSouth AmericaSouth Central AsiaSouth Eastern AsiaSouthern EuropeSpainSri LankaSt. Vincent and the GrenadinesSudanSwedenSwitzerlandSyriaTaiwanThailandTrinidad and TobagoTurkeyUgandaUkraineUruguayUzbekistanVenezuelaVietnamWest IndiesWestern AfricaWestern AsiaWestern EuropeYemenZaireZimbabweAzores
Unemployment Among Seniors over 75 years
Income
Poverty
Unemployment
Labor Participation
Family Structure
Vehicle Availability
Education Level
Disability

Unemployment Among Seniors over 75 years Comparison

Alsatians

Immigrants from Cabo Verde

Exceptional
Tragic
6.1%
UNEMPLOYMENT AMONG SENIORS OVER 75 YEARS
100.0/ 100
METRIC RATING
4th/ 347
METRIC RANK
12.3%
UNEMPLOYMENT AMONG SENIORS OVER 75 YEARS
0.0/ 100
METRIC RATING
338th/ 347
METRIC RANK

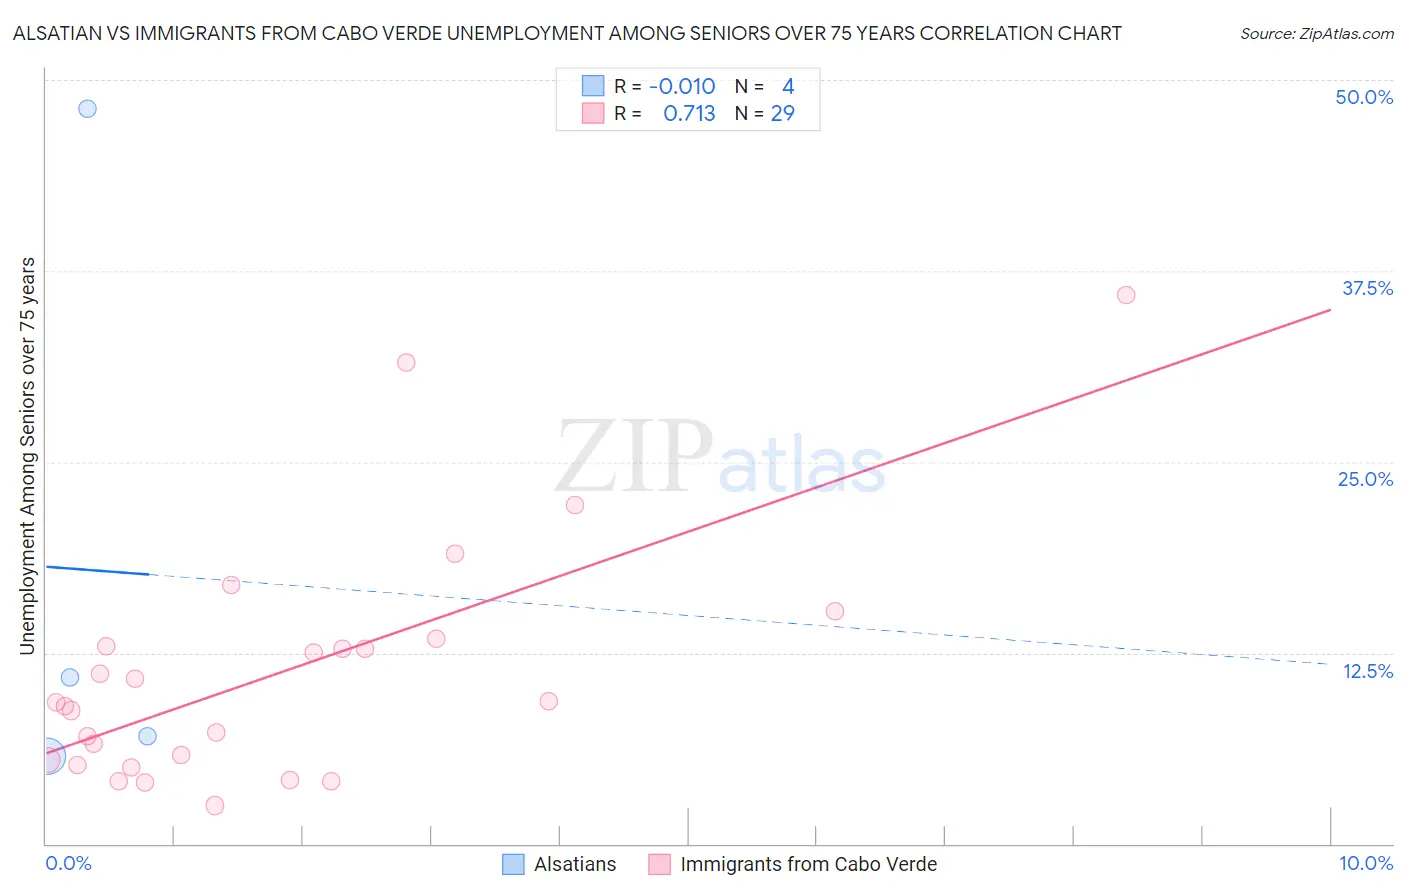
Alsatian vs Immigrants from Cabo Verde Unemployment Among Seniors over 75 years Correlation Chart

The statistical analysis conducted on geographies consisting of 64,928,583 people shows no correlation between the proportion of Alsatians and unemployment rate among seniors over the age of 75 in the United States with a correlation coefficient (R) of -0.010 and weighted average of 6.1%. Similarly, the statistical analysis conducted on geographies consisting of 29,962,388 people shows a strong positive correlation between the proportion of Immigrants from Cabo Verde and unemployment rate among seniors over the age of 75 in the United States with a correlation coefficient (R) of 0.713 and weighted average of 12.3%, a difference of 101.6%.
Alsatian vs Immigrants from Cabo Verde Unemployment Among Seniors over 75 years

Unemployment Among Seniors over 75 years Correlation Summary

MeasurementAlsatianImmigrants from Cabo Verde
Minimum5.7%2.5%
Maximum48.1%35.9%
Range42.4%33.4%
Mean17.9%11.2%
Median8.9%9.2%
Interquartile 25% (IQ1)6.4%5.3%
Interquartile 75% (IQ3)29.5%13.2%
Interquartile Range (IQR)23.1%7.8%
Standard Deviation (Sample)20.2%7.9%
Standard Deviation (Population)17.5%7.8%

Similar Demographics by Unemployment Among Seniors over 75 years

Demographics Similar to Alsatians by Unemployment Among Seniors over 75 years

In terms of unemployment among seniors over 75 years, the demographic groups most similar to Alsatians are Hopi (6.3%, a difference of 2.6%), Cheyenne (5.9%, a difference of 2.9%), Chinese (5.9%, a difference of 3.5%), Crow (5.9%, a difference of 3.5%), and Immigrants from Armenia (6.5%, a difference of 6.5%).
DemographicsRating | RankUnemployment Among Seniors over 75 years
Crow
100.0
/100
|
#1
Exceptional
5.9%
Chinese
100.0
/100
|
#2
Exceptional
5.9%
Cheyenne
100.0
/100
|
#3
Exceptional
5.9%
Alsatians
100.0
/100
|
#4
Exceptional
6.1%
Hopi
100.0
/100
|
#5
Exceptional
6.3%
Immigrants | Armenia
100.0
/100
|
#6
Exceptional
6.5%
Spanish American Indians
100.0
/100
|
#7
Exceptional
6.5%
Taiwanese
100.0
/100
|
#8
Exceptional
6.6%
Soviet Union
100.0
/100
|
#9
Exceptional
6.6%
Yuman
100.0
/100
|
#10
Exceptional
6.7%
Immigrants | Grenada
100.0
/100
|
#11
Exceptional
6.7%
Comanche
100.0
/100
|
#12
Exceptional
6.7%
Immigrants | Congo
100.0
/100
|
#13
Exceptional
6.7%
Ute
100.0
/100
|
#14
Exceptional
6.8%
Icelanders
100.0
/100
|
#15
Exceptional
7.0%

Demographics Similar to Immigrants from Cabo Verde by Unemployment Among Seniors over 75 years

In terms of unemployment among seniors over 75 years, the demographic groups most similar to Immigrants from Cabo Verde are Cajun (12.5%, a difference of 1.3%), Yup'ik (12.8%, a difference of 3.5%), Cape Verdean (11.4%, a difference of 8.1%), Immigrants from North Macedonia (11.3%, a difference of 9.0%), and Lumbee (13.5%, a difference of 9.2%).
DemographicsRating | RankUnemployment Among Seniors over 75 years
Tohono O'odham
0.0
/100
|
#331
Tragic
10.8%
Immigrants | Liberia
0.0
/100
|
#332
Tragic
10.9%
Alaskan Athabascans
0.0
/100
|
#333
Tragic
11.0%
Assyrians/Chaldeans/Syriacs
0.0
/100
|
#334
Tragic
11.1%
French Canadians
0.0
/100
|
#335
Tragic
11.2%
Immigrants | North Macedonia
0.0
/100
|
#336
Tragic
11.3%
Cape Verdeans
0.0
/100
|
#337
Tragic
11.4%
Immigrants | Cabo Verde
0.0
/100
|
#338
Tragic
12.3%
Cajuns
0.0
/100
|
#339
Tragic
12.5%
Yup'ik
0.0
/100
|
#340
Tragic
12.8%
Lumbee
0.0
/100
|
#341
Tragic
13.5%
Hmong
0.0
/100
|
#342
Tragic
13.7%
Alaska Natives
0.0
/100
|
#343
Tragic
14.7%
Immigrants | Yemen
0.0
/100
|
#344
Tragic
16.5%
Yakama
0.0
/100
|
#345
Tragic
18.4%