Egyptian vs Icelander Unemployment Among Ages 55 to 59 years
COMPARE
Egyptian
Icelander
Unemployment Among Ages 55 to 59 years
Unemployment Among Ages 55 to 59 years Comparison
Egyptians
Icelanders
4.7%
UNEMPLOYMENT AMONG AGES 55 TO 59 YEARS
92.9/ 100
METRIC RATING
110th/ 347
METRIC RANK
4.7%
UNEMPLOYMENT AMONG AGES 55 TO 59 YEARS
87.7/ 100
METRIC RATING
127th/ 347
METRIC RANK
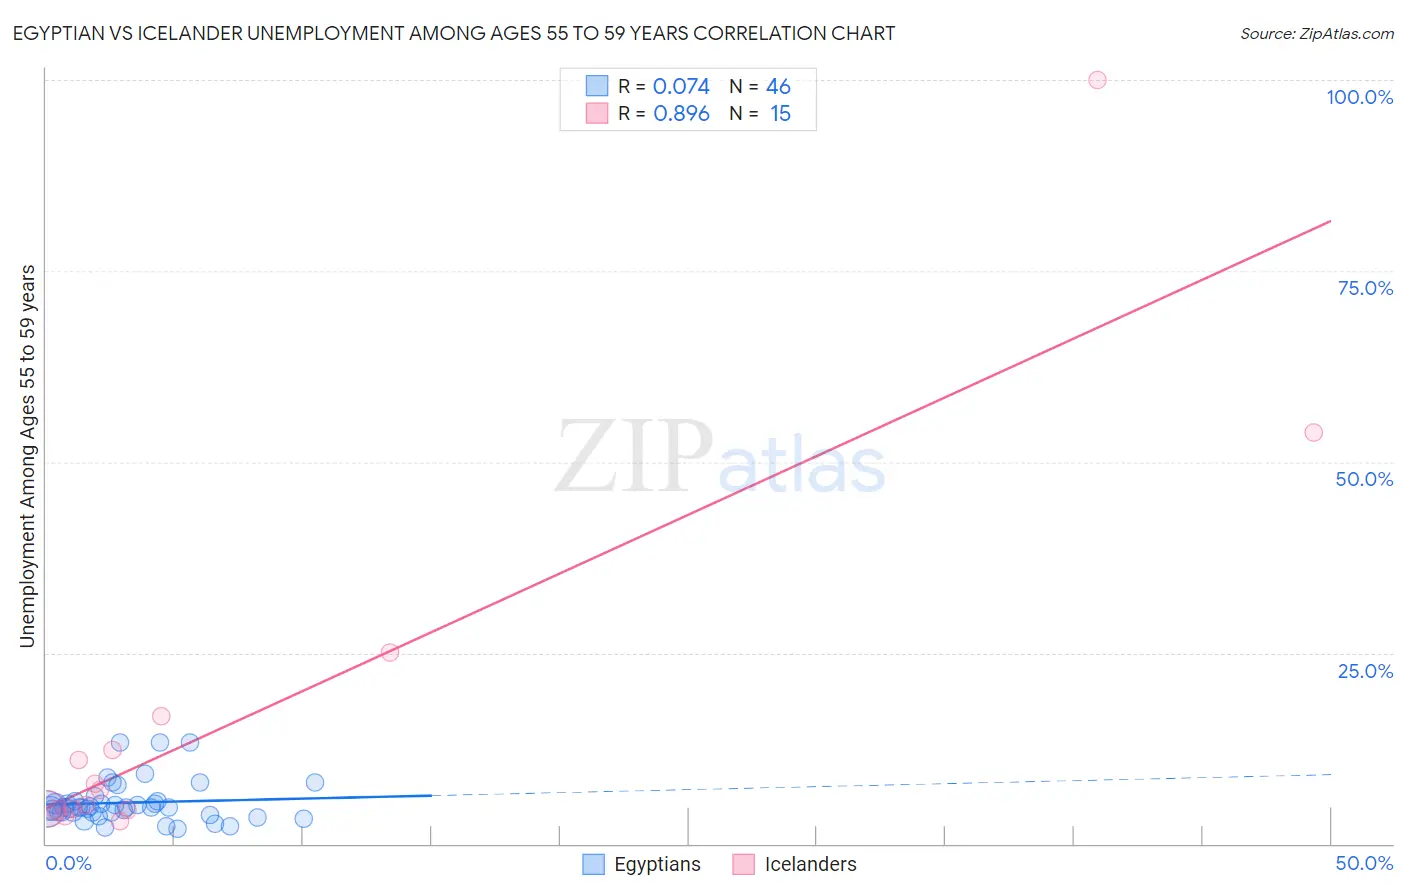
Egyptian vs Icelander Unemployment Among Ages 55 to 59 years Correlation Chart
The statistical analysis conducted on geographies consisting of 266,048,407 people shows a slight positive correlation between the proportion of Egyptians and unemployment rate among population between the ages 55 and 59 in the United States with a correlation coefficient (R) of 0.074 and weighted average of 4.7%. Similarly, the statistical analysis conducted on geographies consisting of 153,163,918 people shows a very strong positive correlation between the proportion of Icelanders and unemployment rate among population between the ages 55 and 59 in the United States with a correlation coefficient (R) of 0.896 and weighted average of 4.7%, a difference of 0.63%.
Unemployment Among Ages 55 to 59 years Correlation Summary
| Measurement | Egyptian | Icelander |
| Minimum | 2.0% | 2.9% |
| Maximum | 13.3% | 100.0% |
| Range | 11.3% | 97.1% |
| Mean | 5.4% | 17.5% |
| Median | 4.7% | 7.0% |
| Interquartile 25% (IQ1) | 4.1% | 4.5% |
| Interquartile 75% (IQ3) | 5.5% | 16.7% |
| Interquartile Range (IQR) | 1.4% | 12.2% |
| Standard Deviation (Sample) | 2.7% | 26.3% |
| Standard Deviation (Population) | 2.7% | 25.4% |
Demographics Similar to Egyptians and Icelanders by Unemployment Among Ages 55 to 59 years
In terms of unemployment among ages 55 to 59 years, the demographic groups most similar to Egyptians are Chilean (4.7%, a difference of 0.050%), French (4.7%, a difference of 0.060%), Austrian (4.7%, a difference of 0.070%), Afghan (4.7%, a difference of 0.11%), and Immigrants from Spain (4.7%, a difference of 0.21%). Similarly, the demographic groups most similar to Icelanders are Immigrants from Serbia (4.7%, a difference of 0.010%), Immigrants from Malaysia (4.7%, a difference of 0.020%), Pennsylvania German (4.7%, a difference of 0.050%), Lithuanian (4.7%, a difference of 0.12%), and Immigrants from Japan (4.7%, a difference of 0.18%).
| Demographics | Rating | Rank | Unemployment Among Ages 55 to 59 years |
| French | 93.3 /100 | #108 | Exceptional 4.7% |
| Chileans | 93.2 /100 | #109 | Exceptional 4.7% |
| Egyptians | 92.9 /100 | #110 | Exceptional 4.7% |
| Austrians | 92.4 /100 | #111 | Exceptional 4.7% |
| Afghans | 92.1 /100 | #112 | Exceptional 4.7% |
| Immigrants | Spain | 91.4 /100 | #113 | Exceptional 4.7% |
| Bangladeshis | 91.3 /100 | #114 | Exceptional 4.7% |
| South American Indians | 90.9 /100 | #115 | Exceptional 4.7% |
| Turks | 90.9 /100 | #116 | Exceptional 4.7% |
| Asians | 90.8 /100 | #117 | Exceptional 4.7% |
| Immigrants | Chile | 90.7 /100 | #118 | Exceptional 4.7% |
| Whites/Caucasians | 90.7 /100 | #119 | Exceptional 4.7% |
| Immigrants | South Africa | 89.9 /100 | #120 | Excellent 4.7% |
| Pakistanis | 89.7 /100 | #121 | Excellent 4.7% |
| Immigrants | Afghanistan | 89.5 /100 | #122 | Excellent 4.7% |
| Immigrants | Japan | 89.4 /100 | #123 | Excellent 4.7% |
| Lithuanians | 88.8 /100 | #124 | Excellent 4.7% |
| Immigrants | Malaysia | 87.9 /100 | #125 | Excellent 4.7% |
| Immigrants | Serbia | 87.8 /100 | #126 | Excellent 4.7% |
| Icelanders | 87.7 /100 | #127 | Excellent 4.7% |
| Pennsylvania Germans | 87.1 /100 | #128 | Excellent 4.7% |