Egyptian vs Immigrants from South Eastern Asia Unemployment Among Ages 55 to 59 years
COMPARE
Egyptian
Immigrants from South Eastern Asia
Unemployment Among Ages 55 to 59 years
Unemployment Among Ages 55 to 59 years Comparison
Egyptians
Immigrants from South Eastern Asia
4.7%
UNEMPLOYMENT AMONG AGES 55 TO 59 YEARS
92.9/ 100
METRIC RATING
110th/ 347
METRIC RANK
4.8%
UNEMPLOYMENT AMONG AGES 55 TO 59 YEARS
77.4/ 100
METRIC RATING
146th/ 347
METRIC RANK
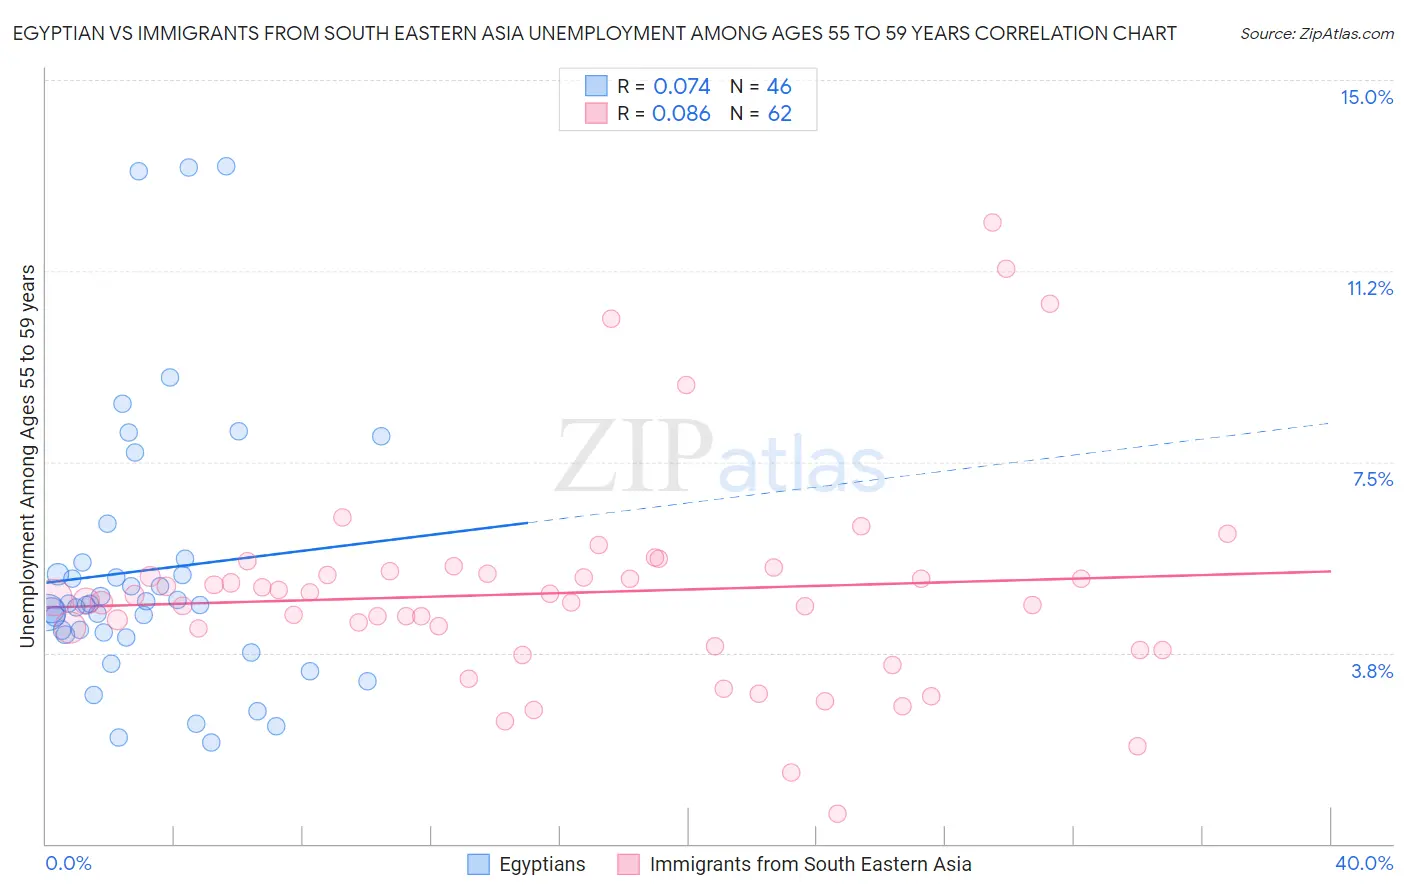
Egyptian vs Immigrants from South Eastern Asia Unemployment Among Ages 55 to 59 years Correlation Chart
The statistical analysis conducted on geographies consisting of 266,048,407 people shows a slight positive correlation between the proportion of Egyptians and unemployment rate among population between the ages 55 and 59 in the United States with a correlation coefficient (R) of 0.074 and weighted average of 4.7%. Similarly, the statistical analysis conducted on geographies consisting of 458,663,823 people shows a slight positive correlation between the proportion of Immigrants from South Eastern Asia and unemployment rate among population between the ages 55 and 59 in the United States with a correlation coefficient (R) of 0.086 and weighted average of 4.8%, a difference of 1.4%.
Unemployment Among Ages 55 to 59 years Correlation Summary
| Measurement | Egyptian | Immigrants from South Eastern Asia |
| Minimum | 2.0% | 0.60% |
| Maximum | 13.3% | 12.2% |
| Range | 11.3% | 11.6% |
| Mean | 5.4% | 4.9% |
| Median | 4.7% | 4.8% |
| Interquartile 25% (IQ1) | 4.1% | 3.9% |
| Interquartile 75% (IQ3) | 5.5% | 5.3% |
| Interquartile Range (IQR) | 1.4% | 1.4% |
| Standard Deviation (Sample) | 2.7% | 2.1% |
| Standard Deviation (Population) | 2.7% | 2.1% |
Similar Demographics by Unemployment Among Ages 55 to 59 years
Demographics Similar to Egyptians by Unemployment Among Ages 55 to 59 years
In terms of unemployment among ages 55 to 59 years, the demographic groups most similar to Egyptians are Chilean (4.7%, a difference of 0.050%), French (4.7%, a difference of 0.060%), Austrian (4.7%, a difference of 0.070%), Immigrants from Egypt (4.7%, a difference of 0.10%), and Afghan (4.7%, a difference of 0.11%).
| Demographics | Rating | Rank | Unemployment Among Ages 55 to 59 years |
| Immigrants | Oceania | 94.0 /100 | #103 | Exceptional 4.7% |
| Immigrants | Turkey | 93.9 /100 | #104 | Exceptional 4.7% |
| Immigrants | North America | 93.9 /100 | #105 | Exceptional 4.7% |
| Immigrants | Laos | 93.9 /100 | #106 | Exceptional 4.7% |
| Immigrants | Egypt | 93.5 /100 | #107 | Exceptional 4.7% |
| French | 93.3 /100 | #108 | Exceptional 4.7% |
| Chileans | 93.2 /100 | #109 | Exceptional 4.7% |
| Egyptians | 92.9 /100 | #110 | Exceptional 4.7% |
| Austrians | 92.4 /100 | #111 | Exceptional 4.7% |
| Afghans | 92.1 /100 | #112 | Exceptional 4.7% |
| Immigrants | Spain | 91.4 /100 | #113 | Exceptional 4.7% |
| Bangladeshis | 91.3 /100 | #114 | Exceptional 4.7% |
| South American Indians | 90.9 /100 | #115 | Exceptional 4.7% |
| Turks | 90.9 /100 | #116 | Exceptional 4.7% |
| Asians | 90.8 /100 | #117 | Exceptional 4.7% |
Demographics Similar to Immigrants from South Eastern Asia by Unemployment Among Ages 55 to 59 years
In terms of unemployment among ages 55 to 59 years, the demographic groups most similar to Immigrants from South Eastern Asia are Immigrants from Northern Europe (4.8%, a difference of 0.010%), Immigrants from Asia (4.8%, a difference of 0.020%), Immigrants from Singapore (4.8%, a difference of 0.050%), Ukrainian (4.8%, a difference of 0.070%), and Immigrants from Norway (4.8%, a difference of 0.14%).
| Demographics | Rating | Rank | Unemployment Among Ages 55 to 59 years |
| Romanians | 82.7 /100 | #139 | Excellent 4.7% |
| Immigrants | Indonesia | 80.2 /100 | #140 | Excellent 4.8% |
| French Canadians | 80.1 /100 | #141 | Excellent 4.8% |
| Immigrants | Norway | 79.8 /100 | #142 | Good 4.8% |
| Ukrainians | 78.6 /100 | #143 | Good 4.8% |
| Immigrants | Asia | 77.8 /100 | #144 | Good 4.8% |
| Immigrants | Northern Europe | 77.5 /100 | #145 | Good 4.8% |
| Immigrants | South Eastern Asia | 77.4 /100 | #146 | Good 4.8% |
| Immigrants | Singapore | 76.6 /100 | #147 | Good 4.8% |
| Immigrants | Bahamas | 71.8 /100 | #148 | Good 4.8% |
| Immigrants | Lithuania | 70.8 /100 | #149 | Good 4.8% |
| Immigrants | Northern Africa | 69.8 /100 | #150 | Good 4.8% |
| Bahamians | 68.6 /100 | #151 | Good 4.8% |
| Laotians | 68.2 /100 | #152 | Good 4.8% |
| Immigrants | Uruguay | 67.2 /100 | #153 | Good 4.8% |