Immigrants from Asia vs Icelander Unemployment Among Ages 55 to 59 years
COMPARE
Immigrants from Asia
Icelander
Unemployment Among Ages 55 to 59 years
Unemployment Among Ages 55 to 59 years Comparison
Immigrants from Asia
Icelanders
4.8%
UNEMPLOYMENT AMONG AGES 55 TO 59 YEARS
77.8/ 100
METRIC RATING
144th/ 347
METRIC RANK
4.7%
UNEMPLOYMENT AMONG AGES 55 TO 59 YEARS
87.7/ 100
METRIC RATING
127th/ 347
METRIC RANK
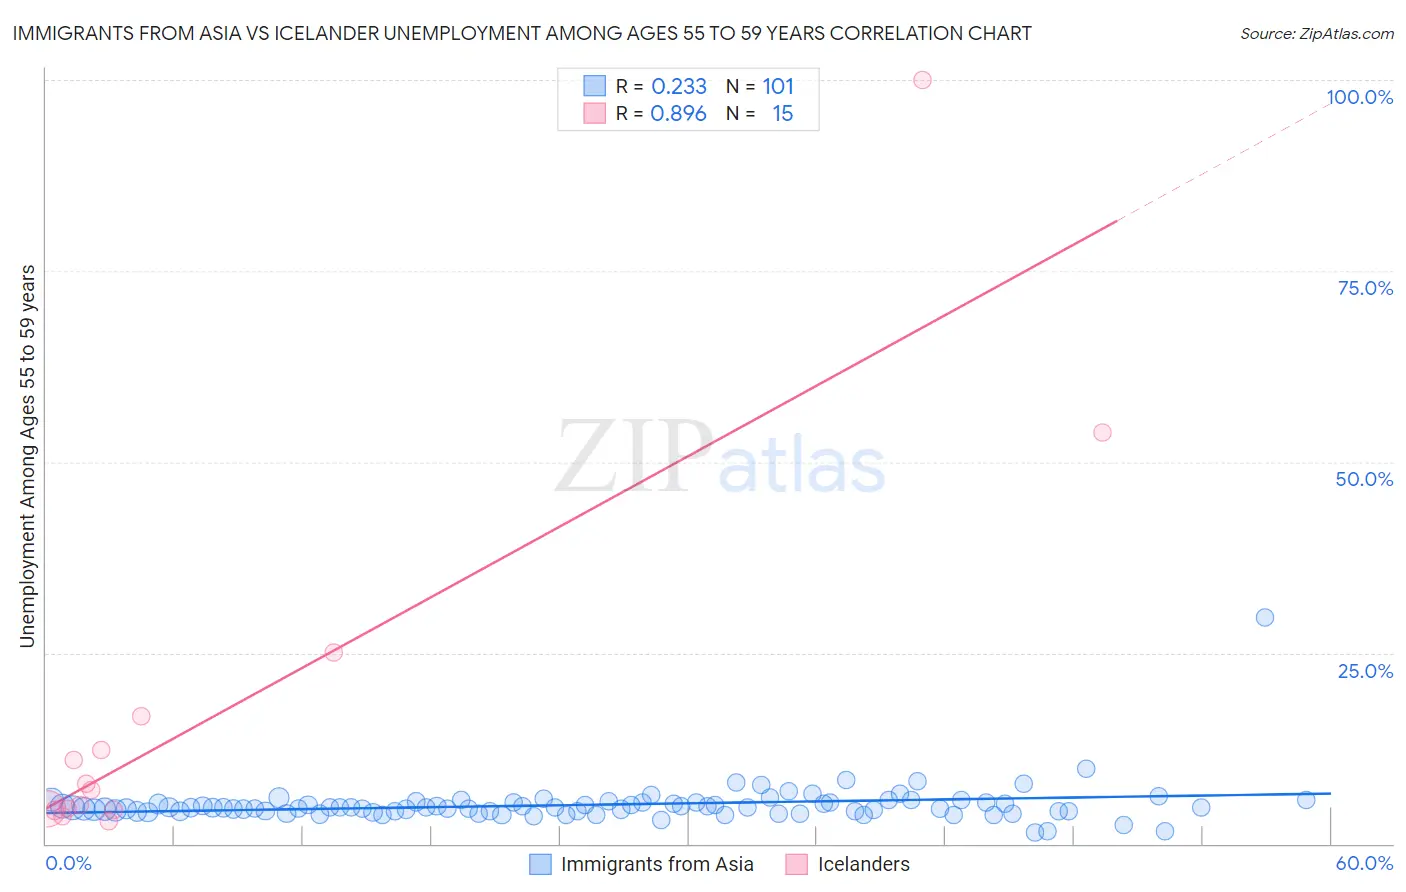
Immigrants from Asia vs Icelander Unemployment Among Ages 55 to 59 years Correlation Chart
The statistical analysis conducted on geographies consisting of 479,879,185 people shows a weak positive correlation between the proportion of Immigrants from Asia and unemployment rate among population between the ages 55 and 59 in the United States with a correlation coefficient (R) of 0.233 and weighted average of 4.8%. Similarly, the statistical analysis conducted on geographies consisting of 153,163,918 people shows a very strong positive correlation between the proportion of Icelanders and unemployment rate among population between the ages 55 and 59 in the United States with a correlation coefficient (R) of 0.896 and weighted average of 4.7%, a difference of 0.73%.
Unemployment Among Ages 55 to 59 years Correlation Summary
| Measurement | Immigrants from Asia | Icelander |
| Minimum | 1.5% | 2.9% |
| Maximum | 29.7% | 100.0% |
| Range | 28.2% | 97.1% |
| Mean | 5.1% | 17.5% |
| Median | 4.7% | 7.0% |
| Interquartile 25% (IQ1) | 4.3% | 4.5% |
| Interquartile 75% (IQ3) | 5.5% | 16.7% |
| Interquartile Range (IQR) | 1.2% | 12.2% |
| Standard Deviation (Sample) | 2.8% | 26.3% |
| Standard Deviation (Population) | 2.8% | 25.4% |
Demographics Similar to Immigrants from Asia and Icelanders by Unemployment Among Ages 55 to 59 years
In terms of unemployment among ages 55 to 59 years, the demographic groups most similar to Immigrants from Asia are Immigrants from Northern Europe (4.8%, a difference of 0.020%), Ukrainian (4.8%, a difference of 0.050%), Immigrants from Norway (4.8%, a difference of 0.12%), French Canadian (4.8%, a difference of 0.14%), and Immigrants from Indonesia (4.8%, a difference of 0.15%). Similarly, the demographic groups most similar to Icelanders are Immigrants from Serbia (4.7%, a difference of 0.010%), Immigrants from Malaysia (4.7%, a difference of 0.020%), Pennsylvania German (4.7%, a difference of 0.050%), Immigrants from Sweden (4.7%, a difference of 0.090%), and Greek (4.7%, a difference of 0.10%).
| Demographics | Rating | Rank | Unemployment Among Ages 55 to 59 years |
| Immigrants | Malaysia | 87.9 /100 | #125 | Excellent 4.7% |
| Immigrants | Serbia | 87.8 /100 | #126 | Excellent 4.7% |
| Icelanders | 87.7 /100 | #127 | Excellent 4.7% |
| Pennsylvania Germans | 87.1 /100 | #128 | Excellent 4.7% |
| Immigrants | Sweden | 86.8 /100 | #129 | Excellent 4.7% |
| Greeks | 86.6 /100 | #130 | Excellent 4.7% |
| Immigrants | Thailand | 85.4 /100 | #131 | Excellent 4.7% |
| Immigrants | Romania | 85.3 /100 | #132 | Excellent 4.7% |
| Immigrants | Netherlands | 84.5 /100 | #133 | Excellent 4.7% |
| Panamanians | 84.1 /100 | #134 | Excellent 4.7% |
| Slavs | 83.7 /100 | #135 | Excellent 4.7% |
| Colombians | 83.6 /100 | #136 | Excellent 4.7% |
| Delaware | 83.6 /100 | #137 | Excellent 4.7% |
| Immigrants | Switzerland | 82.9 /100 | #138 | Excellent 4.7% |
| Romanians | 82.7 /100 | #139 | Excellent 4.7% |
| Immigrants | Indonesia | 80.2 /100 | #140 | Excellent 4.8% |
| French Canadians | 80.1 /100 | #141 | Excellent 4.8% |
| Immigrants | Norway | 79.8 /100 | #142 | Good 4.8% |
| Ukrainians | 78.6 /100 | #143 | Good 4.8% |
| Immigrants | Asia | 77.8 /100 | #144 | Good 4.8% |
| Immigrants | Northern Europe | 77.5 /100 | #145 | Good 4.8% |