Ecuadorian vs Icelander Unemployment Among Ages 55 to 59 years
COMPARE
Ecuadorian
Icelander
Unemployment Among Ages 55 to 59 years
Unemployment Among Ages 55 to 59 years Comparison
Ecuadorians
Icelanders
5.6%
UNEMPLOYMENT AMONG AGES 55 TO 59 YEARS
0.0/ 100
METRIC RATING
312th/ 347
METRIC RANK
4.7%
UNEMPLOYMENT AMONG AGES 55 TO 59 YEARS
87.7/ 100
METRIC RATING
127th/ 347
METRIC RANK
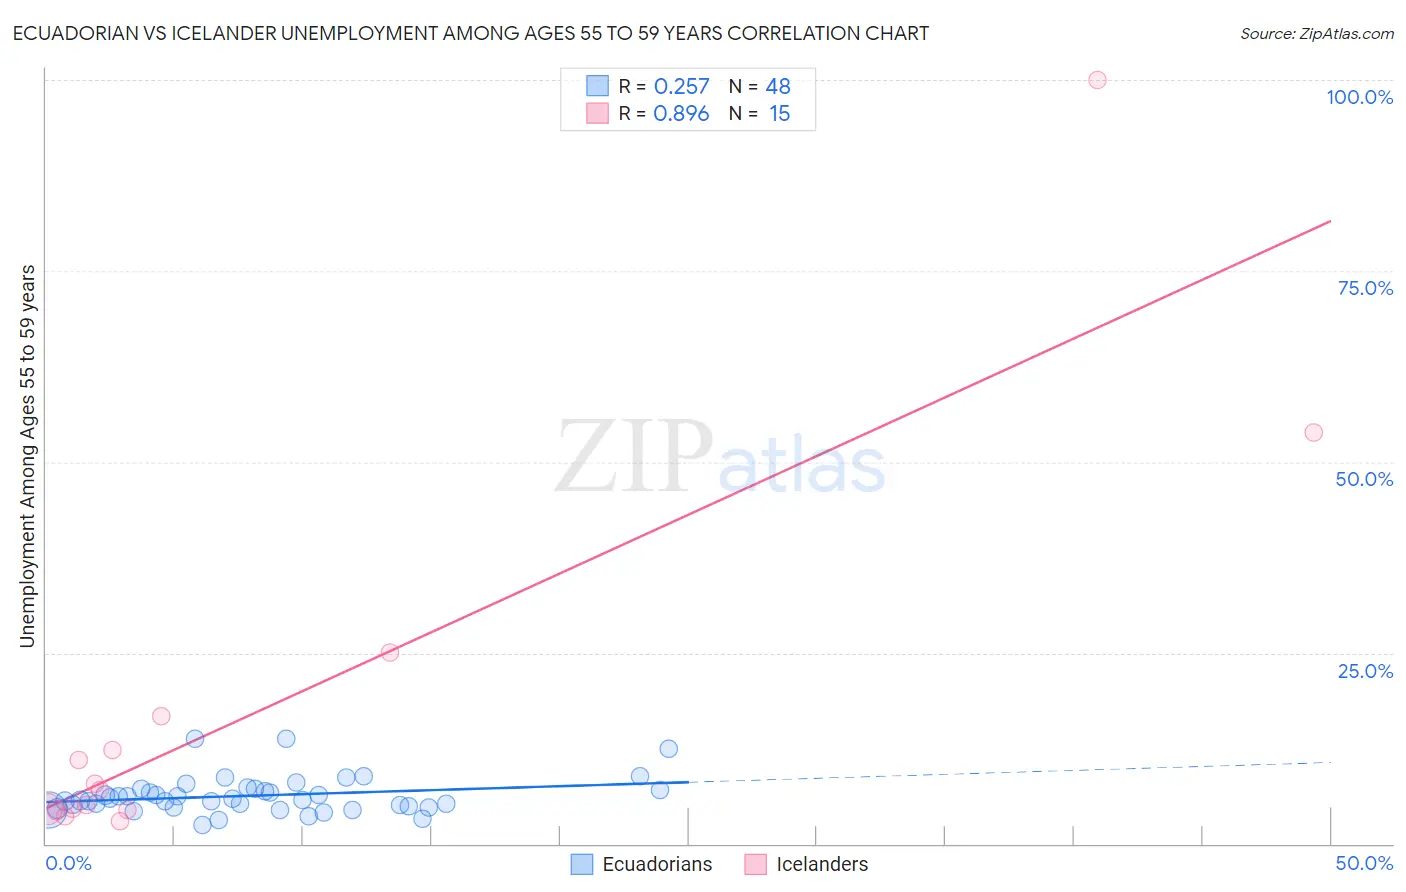
Ecuadorian vs Icelander Unemployment Among Ages 55 to 59 years Correlation Chart
The statistical analysis conducted on geographies consisting of 302,298,527 people shows a weak positive correlation between the proportion of Ecuadorians and unemployment rate among population between the ages 55 and 59 in the United States with a correlation coefficient (R) of 0.257 and weighted average of 5.6%. Similarly, the statistical analysis conducted on geographies consisting of 153,163,918 people shows a very strong positive correlation between the proportion of Icelanders and unemployment rate among population between the ages 55 and 59 in the United States with a correlation coefficient (R) of 0.896 and weighted average of 4.7%, a difference of 19.3%.
Unemployment Among Ages 55 to 59 years Correlation Summary
| Measurement | Ecuadorian | Icelander |
| Minimum | 2.5% | 2.9% |
| Maximum | 13.8% | 100.0% |
| Range | 11.3% | 97.1% |
| Mean | 6.3% | 17.5% |
| Median | 5.8% | 7.0% |
| Interquartile 25% (IQ1) | 4.8% | 4.5% |
| Interquartile 75% (IQ3) | 7.1% | 16.7% |
| Interquartile Range (IQR) | 2.3% | 12.2% |
| Standard Deviation (Sample) | 2.4% | 26.3% |
| Standard Deviation (Population) | 2.3% | 25.4% |
Similar Demographics by Unemployment Among Ages 55 to 59 years
Demographics Similar to Ecuadorians by Unemployment Among Ages 55 to 59 years
In terms of unemployment among ages 55 to 59 years, the demographic groups most similar to Ecuadorians are Central American Indian (5.6%, a difference of 0.19%), Houma (5.6%, a difference of 0.21%), Belizean (5.6%, a difference of 0.39%), Tlingit-Haida (5.7%, a difference of 0.48%), and Guyanese (5.7%, a difference of 0.63%).
| Demographics | Rating | Rank | Unemployment Among Ages 55 to 59 years |
| Immigrants | Portugal | 0.0 /100 | #305 | Tragic 5.5% |
| Immigrants | Cabo Verde | 0.0 /100 | #306 | Tragic 5.5% |
| Immigrants | Belize | 0.0 /100 | #307 | Tragic 5.5% |
| Spanish American Indians | 0.0 /100 | #308 | Tragic 5.6% |
| Nepalese | 0.0 /100 | #309 | Tragic 5.6% |
| Belizeans | 0.0 /100 | #310 | Tragic 5.6% |
| Houma | 0.0 /100 | #311 | Tragic 5.6% |
| Ecuadorians | 0.0 /100 | #312 | Tragic 5.6% |
| Central American Indians | 0.0 /100 | #313 | Tragic 5.6% |
| Tlingit-Haida | 0.0 /100 | #314 | Tragic 5.7% |
| Guyanese | 0.0 /100 | #315 | Tragic 5.7% |
| Immigrants | Ecuador | 0.0 /100 | #316 | Tragic 5.7% |
| Hmong | 0.0 /100 | #317 | Tragic 5.7% |
| Immigrants | Guyana | 0.0 /100 | #318 | Tragic 5.8% |
| Kiowa | 0.0 /100 | #319 | Tragic 5.8% |
Demographics Similar to Icelanders by Unemployment Among Ages 55 to 59 years
In terms of unemployment among ages 55 to 59 years, the demographic groups most similar to Icelanders are Immigrants from Serbia (4.7%, a difference of 0.010%), Immigrants from Malaysia (4.7%, a difference of 0.020%), Pennsylvania German (4.7%, a difference of 0.050%), Immigrants from Sweden (4.7%, a difference of 0.090%), and Greek (4.7%, a difference of 0.10%).
| Demographics | Rating | Rank | Unemployment Among Ages 55 to 59 years |
| Immigrants | South Africa | 89.9 /100 | #120 | Excellent 4.7% |
| Pakistanis | 89.7 /100 | #121 | Excellent 4.7% |
| Immigrants | Afghanistan | 89.5 /100 | #122 | Excellent 4.7% |
| Immigrants | Japan | 89.4 /100 | #123 | Excellent 4.7% |
| Lithuanians | 88.8 /100 | #124 | Excellent 4.7% |
| Immigrants | Malaysia | 87.9 /100 | #125 | Excellent 4.7% |
| Immigrants | Serbia | 87.8 /100 | #126 | Excellent 4.7% |
| Icelanders | 87.7 /100 | #127 | Excellent 4.7% |
| Pennsylvania Germans | 87.1 /100 | #128 | Excellent 4.7% |
| Immigrants | Sweden | 86.8 /100 | #129 | Excellent 4.7% |
| Greeks | 86.6 /100 | #130 | Excellent 4.7% |
| Immigrants | Thailand | 85.4 /100 | #131 | Excellent 4.7% |
| Immigrants | Romania | 85.3 /100 | #132 | Excellent 4.7% |
| Immigrants | Netherlands | 84.5 /100 | #133 | Excellent 4.7% |
| Panamanians | 84.1 /100 | #134 | Excellent 4.7% |