Egyptian vs African Unemployment Among Women with Children Ages 6 to 17 years
COMPARE
Egyptian
African
Unemployment Among Women with Children Ages 6 to 17 years
Unemployment Among Women with Children Ages 6 to 17 years Comparison
Egyptians
Africans
8.7%
UNEMPLOYMENT AMONG WOMEN WITH CHILDREN AGES 6 TO 17 YEARS
91.8/ 100
METRIC RATING
133rd/ 347
METRIC RANK
10.4%
UNEMPLOYMENT AMONG WOMEN WITH CHILDREN AGES 6 TO 17 YEARS
0.0/ 100
METRIC RATING
312th/ 347
METRIC RANK
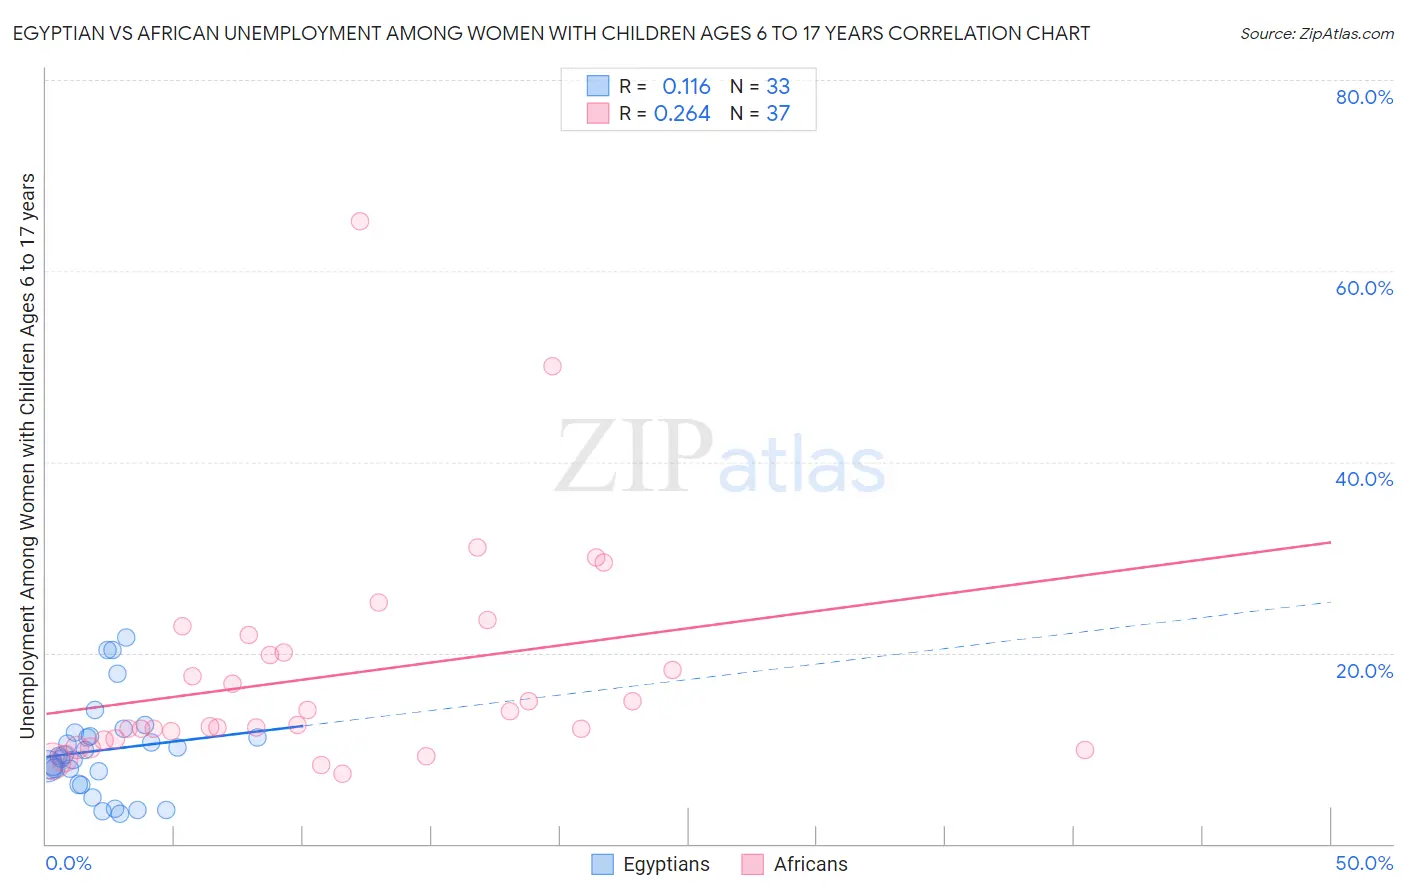
Egyptian vs African Unemployment Among Women with Children Ages 6 to 17 years Correlation Chart
The statistical analysis conducted on geographies consisting of 213,857,106 people shows a poor positive correlation between the proportion of Egyptians and unemployment rate among women with children between the ages 6 and 17 in the United States with a correlation coefficient (R) of 0.116 and weighted average of 8.7%. Similarly, the statistical analysis conducted on geographies consisting of 330,667,716 people shows a weak positive correlation between the proportion of Africans and unemployment rate among women with children between the ages 6 and 17 in the United States with a correlation coefficient (R) of 0.264 and weighted average of 10.4%, a difference of 19.2%.
Unemployment Among Women with Children Ages 6 to 17 years Correlation Summary
| Measurement | Egyptian | African |
| Minimum | 3.2% | 7.3% |
| Maximum | 21.6% | 65.2% |
| Range | 18.4% | 57.9% |
| Mean | 9.8% | 17.6% |
| Median | 9.2% | 12.5% |
| Interquartile 25% (IQ1) | 6.9% | 10.9% |
| Interquartile 75% (IQ3) | 11.5% | 21.0% |
| Interquartile Range (IQR) | 4.6% | 10.1% |
| Standard Deviation (Sample) | 4.8% | 11.7% |
| Standard Deviation (Population) | 4.7% | 11.5% |
Similar Demographics by Unemployment Among Women with Children Ages 6 to 17 years
Demographics Similar to Egyptians by Unemployment Among Women with Children Ages 6 to 17 years
In terms of unemployment among women with children ages 6 to 17 years, the demographic groups most similar to Egyptians are Yaqui (8.7%, a difference of 0.060%), Slavic (8.7%, a difference of 0.070%), Immigrants from Ireland (8.7%, a difference of 0.11%), European (8.7%, a difference of 0.17%), and Immigrants from Latvia (8.7%, a difference of 0.20%).
| Demographics | Rating | Rank | Unemployment Among Women with Children Ages 6 to 17 years |
| Immigrants | Northern Africa | 94.4 /100 | #126 | Exceptional 8.7% |
| Czechs | 94.4 /100 | #127 | Exceptional 8.7% |
| Hmong | 94.3 /100 | #128 | Exceptional 8.7% |
| Barbadians | 93.8 /100 | #129 | Exceptional 8.7% |
| Immigrants | Western Asia | 93.1 /100 | #130 | Exceptional 8.7% |
| Slavs | 92.2 /100 | #131 | Exceptional 8.7% |
| Yaqui | 92.2 /100 | #132 | Exceptional 8.7% |
| Egyptians | 91.8 /100 | #133 | Exceptional 8.7% |
| Immigrants | Ireland | 91.0 /100 | #134 | Exceptional 8.7% |
| Europeans | 90.6 /100 | #135 | Exceptional 8.7% |
| Immigrants | Latvia | 90.4 /100 | #136 | Exceptional 8.7% |
| Immigrants | Argentina | 90.0 /100 | #137 | Excellent 8.7% |
| Immigrants | Ethiopia | 89.5 /100 | #138 | Excellent 8.8% |
| Northern Europeans | 89.2 /100 | #139 | Excellent 8.8% |
| Immigrants | Poland | 88.3 /100 | #140 | Excellent 8.8% |
Demographics Similar to Africans by Unemployment Among Women with Children Ages 6 to 17 years
In terms of unemployment among women with children ages 6 to 17 years, the demographic groups most similar to Africans are American (10.4%, a difference of 0.18%), Immigrants from Cabo Verde (10.4%, a difference of 0.23%), Bahamian (10.4%, a difference of 0.26%), Immigrants from Liberia (10.3%, a difference of 0.84%), and Alaska Native (10.3%, a difference of 0.87%).
| Demographics | Rating | Rank | Unemployment Among Women with Children Ages 6 to 17 years |
| Immigrants | Nigeria | 0.0 /100 | #305 | Tragic 10.2% |
| Paraguayans | 0.0 /100 | #306 | Tragic 10.2% |
| Immigrants | Senegal | 0.0 /100 | #307 | Tragic 10.2% |
| Dutch West Indians | 0.0 /100 | #308 | Tragic 10.2% |
| French Canadians | 0.0 /100 | #309 | Tragic 10.3% |
| Alaska Natives | 0.0 /100 | #310 | Tragic 10.3% |
| Immigrants | Liberia | 0.0 /100 | #311 | Tragic 10.3% |
| Africans | 0.0 /100 | #312 | Tragic 10.4% |
| Americans | 0.0 /100 | #313 | Tragic 10.4% |
| Immigrants | Cabo Verde | 0.0 /100 | #314 | Tragic 10.4% |
| Bahamians | 0.0 /100 | #315 | Tragic 10.4% |
| Immigrants | Dominica | 0.0 /100 | #316 | Tragic 10.5% |
| Bermudans | 0.0 /100 | #317 | Tragic 10.5% |
| Delaware | 0.0 /100 | #318 | Tragic 10.5% |
| Immigrants | Uganda | 0.0 /100 | #319 | Tragic 10.7% |