Egyptian vs Kiowa Unemployment Among Women with Children Ages 6 to 17 years
COMPARE
Egyptian
Kiowa
Unemployment Among Women with Children Ages 6 to 17 years
Unemployment Among Women with Children Ages 6 to 17 years Comparison
Egyptians
Kiowa
8.7%
UNEMPLOYMENT AMONG WOMEN WITH CHILDREN AGES 6 TO 17 YEARS
91.8/ 100
METRIC RATING
133rd/ 347
METRIC RANK
9.6%
UNEMPLOYMENT AMONG WOMEN WITH CHILDREN AGES 6 TO 17 YEARS
0.1/ 100
METRIC RATING
272nd/ 347
METRIC RANK
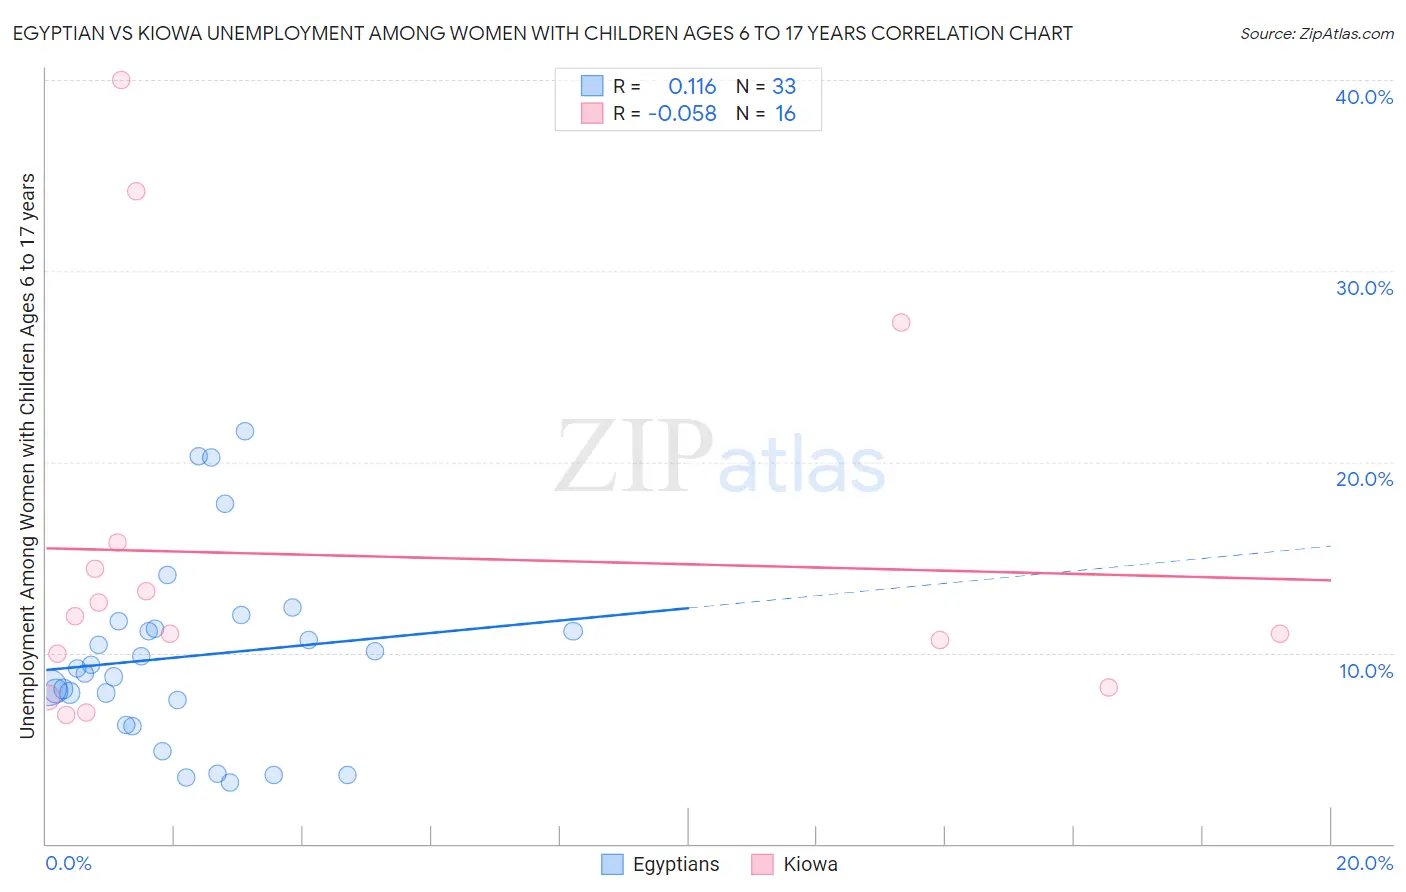
Egyptian vs Kiowa Unemployment Among Women with Children Ages 6 to 17 years Correlation Chart
The statistical analysis conducted on geographies consisting of 213,857,106 people shows a poor positive correlation between the proportion of Egyptians and unemployment rate among women with children between the ages 6 and 17 in the United States with a correlation coefficient (R) of 0.116 and weighted average of 8.7%. Similarly, the statistical analysis conducted on geographies consisting of 51,587,484 people shows a slight negative correlation between the proportion of Kiowa and unemployment rate among women with children between the ages 6 and 17 in the United States with a correlation coefficient (R) of -0.058 and weighted average of 9.6%, a difference of 10.5%.
Unemployment Among Women with Children Ages 6 to 17 years Correlation Summary
| Measurement | Egyptian | Kiowa |
| Minimum | 3.2% | 6.8% |
| Maximum | 21.6% | 40.0% |
| Range | 18.4% | 33.2% |
| Mean | 9.8% | 15.1% |
| Median | 9.2% | 11.5% |
| Interquartile 25% (IQ1) | 6.9% | 9.1% |
| Interquartile 75% (IQ3) | 11.5% | 15.1% |
| Interquartile Range (IQR) | 4.6% | 6.0% |
| Standard Deviation (Sample) | 4.8% | 9.9% |
| Standard Deviation (Population) | 4.7% | 9.6% |
Similar Demographics by Unemployment Among Women with Children Ages 6 to 17 years
Demographics Similar to Egyptians by Unemployment Among Women with Children Ages 6 to 17 years
In terms of unemployment among women with children ages 6 to 17 years, the demographic groups most similar to Egyptians are Yaqui (8.7%, a difference of 0.060%), Slavic (8.7%, a difference of 0.070%), Immigrants from Ireland (8.7%, a difference of 0.11%), European (8.7%, a difference of 0.17%), and Immigrants from Latvia (8.7%, a difference of 0.20%).
| Demographics | Rating | Rank | Unemployment Among Women with Children Ages 6 to 17 years |
| Immigrants | Northern Africa | 94.4 /100 | #126 | Exceptional 8.7% |
| Czechs | 94.4 /100 | #127 | Exceptional 8.7% |
| Hmong | 94.3 /100 | #128 | Exceptional 8.7% |
| Barbadians | 93.8 /100 | #129 | Exceptional 8.7% |
| Immigrants | Western Asia | 93.1 /100 | #130 | Exceptional 8.7% |
| Slavs | 92.2 /100 | #131 | Exceptional 8.7% |
| Yaqui | 92.2 /100 | #132 | Exceptional 8.7% |
| Egyptians | 91.8 /100 | #133 | Exceptional 8.7% |
| Immigrants | Ireland | 91.0 /100 | #134 | Exceptional 8.7% |
| Europeans | 90.6 /100 | #135 | Exceptional 8.7% |
| Immigrants | Latvia | 90.4 /100 | #136 | Exceptional 8.7% |
| Immigrants | Argentina | 90.0 /100 | #137 | Excellent 8.7% |
| Immigrants | Ethiopia | 89.5 /100 | #138 | Excellent 8.8% |
| Northern Europeans | 89.2 /100 | #139 | Excellent 8.8% |
| Immigrants | Poland | 88.3 /100 | #140 | Excellent 8.8% |
Demographics Similar to Kiowa by Unemployment Among Women with Children Ages 6 to 17 years
In terms of unemployment among women with children ages 6 to 17 years, the demographic groups most similar to Kiowa are White/Caucasian (9.6%, a difference of 0.010%), Immigrants from Latin America (9.6%, a difference of 0.060%), Aleut (9.6%, a difference of 0.060%), Immigrants from Nicaragua (9.6%, a difference of 0.46%), and U.S. Virgin Islander (9.7%, a difference of 0.50%).
| Demographics | Rating | Rank | Unemployment Among Women with Children Ages 6 to 17 years |
| West Indians | 0.4 /100 | #265 | Tragic 9.5% |
| Immigrants | Jamaica | 0.3 /100 | #266 | Tragic 9.5% |
| Irish | 0.3 /100 | #267 | Tragic 9.5% |
| Ghanaians | 0.2 /100 | #268 | Tragic 9.6% |
| Blackfeet | 0.2 /100 | #269 | Tragic 9.6% |
| Immigrants | Nicaragua | 0.2 /100 | #270 | Tragic 9.6% |
| Immigrants | Latin America | 0.1 /100 | #271 | Tragic 9.6% |
| Kiowa | 0.1 /100 | #272 | Tragic 9.6% |
| Whites/Caucasians | 0.1 /100 | #273 | Tragic 9.6% |
| Aleuts | 0.1 /100 | #274 | Tragic 9.6% |
| U.S. Virgin Islanders | 0.1 /100 | #275 | Tragic 9.7% |
| Immigrants | Portugal | 0.1 /100 | #276 | Tragic 9.7% |
| British West Indians | 0.1 /100 | #277 | Tragic 9.7% |
| French | 0.1 /100 | #278 | Tragic 9.7% |
| Scotch-Irish | 0.1 /100 | #279 | Tragic 9.7% |