Immigrants from Hong Kong vs Aleut Unemployment Among Ages 60 to 64 years
COMPARE
Immigrants from Hong Kong
Aleut
Unemployment Among Ages 60 to 64 years
Unemployment Among Ages 60 to 64 years Comparison
Immigrants from Hong Kong
Aleuts
5.2%
UNEMPLOYMENT AMONG AGES 60 TO 64 YEARS
0.1/ 100
METRIC RATING
275th/ 347
METRIC RANK
6.8%
UNEMPLOYMENT AMONG AGES 60 TO 64 YEARS
0.0/ 100
METRIC RATING
342nd/ 347
METRIC RANK
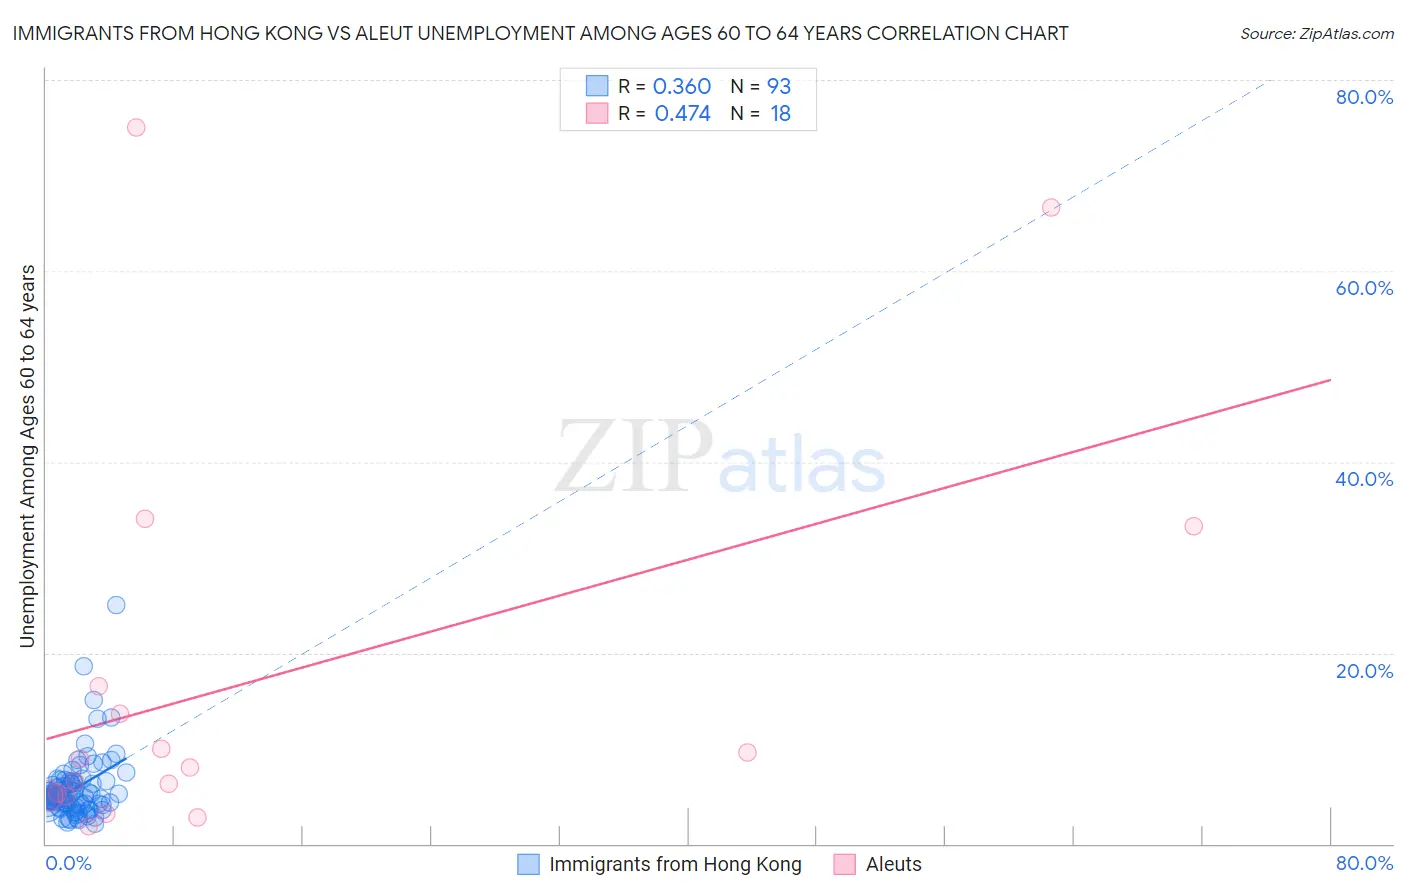
Immigrants from Hong Kong vs Aleut Unemployment Among Ages 60 to 64 years Correlation Chart
The statistical analysis conducted on geographies consisting of 240,391,172 people shows a mild positive correlation between the proportion of Immigrants from Hong Kong and unemployment rate among population between the ages 60 and 64 in the United States with a correlation coefficient (R) of 0.360 and weighted average of 5.2%. Similarly, the statistical analysis conducted on geographies consisting of 59,800,117 people shows a moderate positive correlation between the proportion of Aleuts and unemployment rate among population between the ages 60 and 64 in the United States with a correlation coefficient (R) of 0.474 and weighted average of 6.8%, a difference of 30.7%.
Unemployment Among Ages 60 to 64 years Correlation Summary
| Measurement | Immigrants from Hong Kong | Aleut |
| Minimum | 2.1% | 1.8% |
| Maximum | 25.0% | 75.0% |
| Range | 22.9% | 73.2% |
| Mean | 5.8% | 17.3% |
| Median | 5.0% | 8.5% |
| Interquartile 25% (IQ1) | 4.2% | 5.0% |
| Interquartile 75% (IQ3) | 6.5% | 16.5% |
| Interquartile Range (IQR) | 2.3% | 11.6% |
| Standard Deviation (Sample) | 3.4% | 21.6% |
| Standard Deviation (Population) | 3.3% | 21.0% |
Similar Demographics by Unemployment Among Ages 60 to 64 years
Demographics Similar to Immigrants from Hong Kong by Unemployment Among Ages 60 to 64 years
In terms of unemployment among ages 60 to 64 years, the demographic groups most similar to Immigrants from Hong Kong are Hopi (5.2%, a difference of 0.13%), Central American (5.2%, a difference of 0.16%), Immigrants from Spain (5.2%, a difference of 0.28%), Haitian (5.2%, a difference of 0.35%), and Israeli (5.2%, a difference of 0.38%).
| Demographics | Rating | Rank | Unemployment Among Ages 60 to 64 years |
| Central American Indians | 0.2 /100 | #268 | Tragic 5.1% |
| Immigrants | Costa Rica | 0.2 /100 | #269 | Tragic 5.1% |
| Immigrants | Iran | 0.1 /100 | #270 | Tragic 5.1% |
| Israelis | 0.1 /100 | #271 | Tragic 5.2% |
| Haitians | 0.1 /100 | #272 | Tragic 5.2% |
| Immigrants | Spain | 0.1 /100 | #273 | Tragic 5.2% |
| Hopi | 0.1 /100 | #274 | Tragic 5.2% |
| Immigrants | Hong Kong | 0.1 /100 | #275 | Tragic 5.2% |
| Central Americans | 0.0 /100 | #276 | Tragic 5.2% |
| Immigrants | Caribbean | 0.0 /100 | #277 | Tragic 5.2% |
| Guatemalans | 0.0 /100 | #278 | Tragic 5.2% |
| Nepalese | 0.0 /100 | #279 | Tragic 5.2% |
| French American Indians | 0.0 /100 | #280 | Tragic 5.2% |
| Immigrants | Haiti | 0.0 /100 | #281 | Tragic 5.2% |
| Mexicans | 0.0 /100 | #282 | Tragic 5.2% |
Demographics Similar to Aleuts by Unemployment Among Ages 60 to 64 years
In terms of unemployment among ages 60 to 64 years, the demographic groups most similar to Aleuts are Yuman (6.8%, a difference of 0.010%), Pueblo (6.7%, a difference of 0.54%), Immigrants from Yemen (6.8%, a difference of 0.72%), Tlingit-Haida (6.4%, a difference of 6.1%), and Arapaho (6.3%, a difference of 7.6%).
| Demographics | Rating | Rank | Unemployment Among Ages 60 to 64 years |
| Immigrants | Dominican Republic | 0.0 /100 | #333 | Tragic 6.0% |
| Puerto Ricans | 0.0 /100 | #334 | Tragic 6.1% |
| Vietnamese | 0.0 /100 | #335 | Tragic 6.1% |
| Kiowa | 0.0 /100 | #336 | Tragic 6.2% |
| Navajo | 0.0 /100 | #337 | Tragic 6.3% |
| Arapaho | 0.0 /100 | #338 | Tragic 6.3% |
| Tlingit-Haida | 0.0 /100 | #339 | Tragic 6.4% |
| Pueblo | 0.0 /100 | #340 | Tragic 6.7% |
| Yuman | 0.0 /100 | #341 | Tragic 6.8% |
| Aleuts | 0.0 /100 | #342 | Tragic 6.8% |
| Immigrants | Yemen | 0.0 /100 | #343 | Tragic 6.8% |
| Alaska Natives | 0.0 /100 | #344 | Tragic 7.6% |
| Alaskan Athabascans | 0.0 /100 | #345 | Tragic 8.4% |
| Inupiat | 0.0 /100 | #346 | Tragic 9.6% |
| Yup'ik | 0.0 /100 | #347 | Tragic 11.9% |