Eastern European vs Tohono O'odham Female Unemployment
COMPARE
Eastern European
Tohono O'odham
Female Unemployment
Female Unemployment Comparison
Eastern Europeans
Tohono O'odham
4.9%
FEMALE UNEMPLOYMENT
99.4/ 100
METRIC RATING
43rd/ 347
METRIC RANK
7.7%
FEMALE UNEMPLOYMENT
0.0/ 100
METRIC RATING
338th/ 347
METRIC RANK
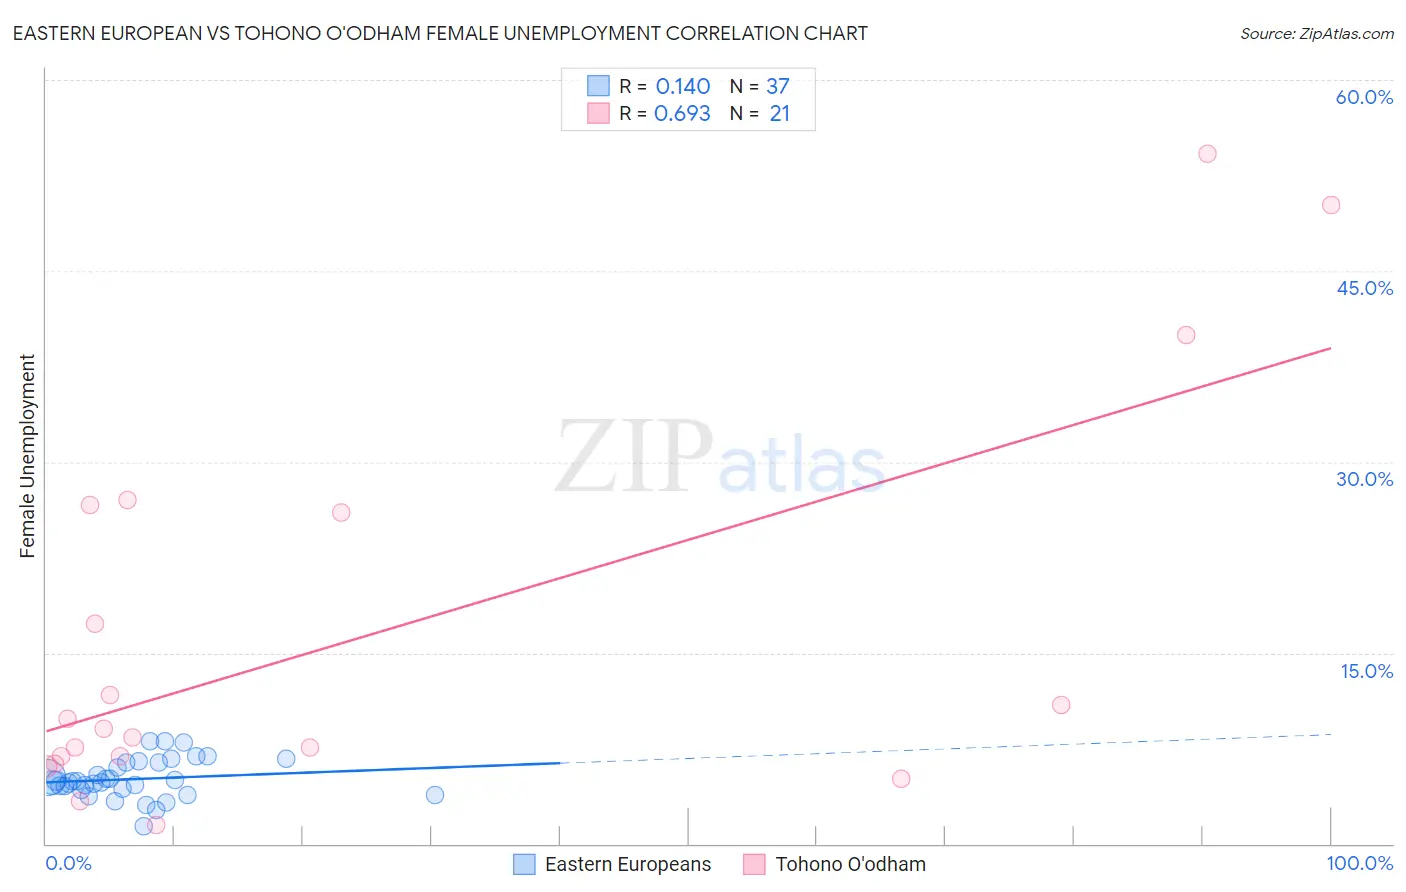
Eastern European vs Tohono O'odham Female Unemployment Correlation Chart
The statistical analysis conducted on geographies consisting of 456,874,876 people shows a poor positive correlation between the proportion of Eastern Europeans and unemploymnet rate among females in the United States with a correlation coefficient (R) of 0.140 and weighted average of 4.9%. Similarly, the statistical analysis conducted on geographies consisting of 58,685,659 people shows a significant positive correlation between the proportion of Tohono O'odham and unemploymnet rate among females in the United States with a correlation coefficient (R) of 0.693 and weighted average of 7.7%, a difference of 59.6%.
Female Unemployment Correlation Summary
| Measurement | Eastern European | Tohono O'odham |
| Minimum | 1.4% | 1.5% |
| Maximum | 8.1% | 54.2% |
| Range | 6.7% | 52.7% |
| Mean | 5.1% | 16.3% |
| Median | 4.9% | 9.0% |
| Interquartile 25% (IQ1) | 4.3% | 6.6% |
| Interquartile 75% (IQ3) | 6.4% | 26.3% |
| Interquartile Range (IQR) | 2.1% | 19.8% |
| Standard Deviation (Sample) | 1.5% | 15.4% |
| Standard Deviation (Population) | 1.5% | 15.0% |
Similar Demographics by Female Unemployment
Demographics Similar to Eastern Europeans by Female Unemployment
In terms of female unemployment, the demographic groups most similar to Eastern Europeans are Greek (4.9%, a difference of 0.11%), Italian (4.8%, a difference of 0.17%), Austrian (4.9%, a difference of 0.18%), Immigrants from Bulgaria (4.9%, a difference of 0.21%), and Okinawan (4.9%, a difference of 0.29%).
| Demographics | Rating | Rank | Female Unemployment |
| Yugoslavians | 99.7 /100 | #36 | Exceptional 4.8% |
| Pennsylvania Germans | 99.6 /100 | #37 | Exceptional 4.8% |
| Northern Europeans | 99.6 /100 | #38 | Exceptional 4.8% |
| Scotch-Irish | 99.6 /100 | #39 | Exceptional 4.8% |
| French | 99.6 /100 | #40 | Exceptional 4.8% |
| Tongans | 99.5 /100 | #41 | Exceptional 4.8% |
| Italians | 99.5 /100 | #42 | Exceptional 4.8% |
| Eastern Europeans | 99.4 /100 | #43 | Exceptional 4.9% |
| Greeks | 99.4 /100 | #44 | Exceptional 4.9% |
| Austrians | 99.3 /100 | #45 | Exceptional 4.9% |
| Immigrants | Bulgaria | 99.3 /100 | #46 | Exceptional 4.9% |
| Okinawans | 99.3 /100 | #47 | Exceptional 4.9% |
| Thais | 99.2 /100 | #48 | Exceptional 4.9% |
| Australians | 99.2 /100 | #49 | Exceptional 4.9% |
| Immigrants | Cuba | 99.1 /100 | #50 | Exceptional 4.9% |
Demographics Similar to Tohono O'odham by Female Unemployment
In terms of female unemployment, the demographic groups most similar to Tohono O'odham are Immigrants from Yemen (7.8%, a difference of 1.2%), Hopi (8.1%, a difference of 4.5%), Inupiat (8.2%, a difference of 5.3%), Navajo (7.3%, a difference of 6.3%), and Immigrants from Dominican Republic (7.2%, a difference of 7.3%).
| Demographics | Rating | Rank | Female Unemployment |
| Paiute | 0.0 /100 | #331 | Tragic 6.8% |
| Sioux | 0.0 /100 | #332 | Tragic 7.0% |
| Menominee | 0.0 /100 | #333 | Tragic 7.0% |
| Immigrants | Armenia | 0.0 /100 | #334 | Tragic 7.1% |
| Dominicans | 0.0 /100 | #335 | Tragic 7.2% |
| Immigrants | Dominican Republic | 0.0 /100 | #336 | Tragic 7.2% |
| Navajo | 0.0 /100 | #337 | Tragic 7.3% |
| Tohono O'odham | 0.0 /100 | #338 | Tragic 7.7% |
| Immigrants | Yemen | 0.0 /100 | #339 | Tragic 7.8% |
| Hopi | 0.0 /100 | #340 | Tragic 8.1% |
| Inupiat | 0.0 /100 | #341 | Tragic 8.2% |
| Puerto Ricans | 0.0 /100 | #342 | Tragic 8.3% |
| Arapaho | 0.0 /100 | #343 | Tragic 8.8% |
| Pima | 0.0 /100 | #344 | Tragic 9.3% |
| Yuman | 0.0 /100 | #345 | Tragic 9.6% |