Dutch West Indian vs Immigrants from Cabo Verde Unemployment Among Ages 30 to 34 years
COMPARE
Dutch West Indian
Immigrants from Cabo Verde
Unemployment Among Ages 30 to 34 years
Unemployment Among Ages 30 to 34 years Comparison
Dutch West Indians
Immigrants from Cabo Verde
6.6%
UNEMPLOYMENT AMONG AGES 30 TO 34 YEARS
0.0/ 100
METRIC RATING
299th/ 347
METRIC RANK
7.2%
UNEMPLOYMENT AMONG AGES 30 TO 34 YEARS
0.0/ 100
METRIC RATING
317th/ 347
METRIC RANK
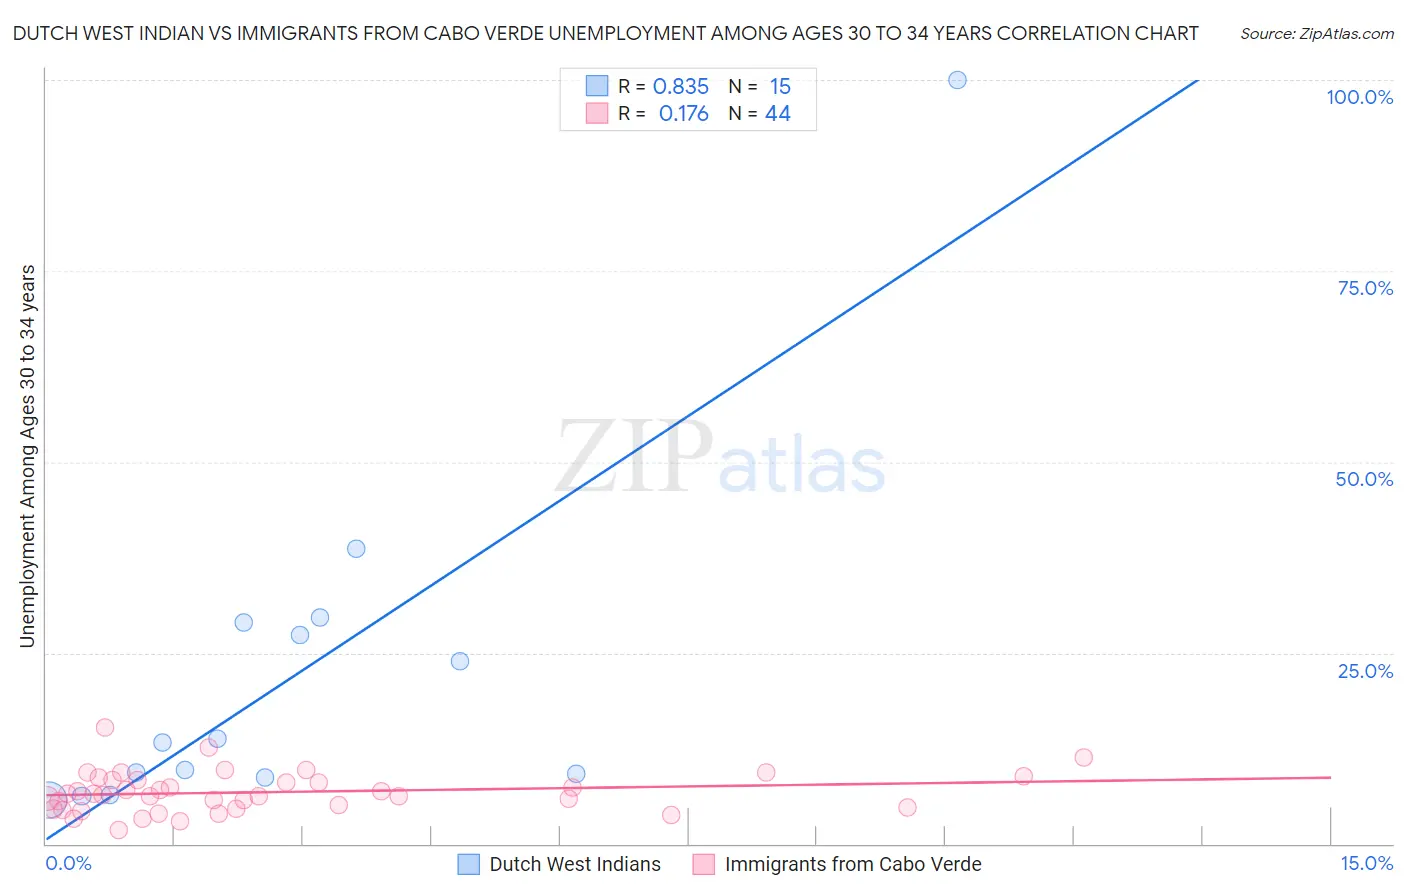
Dutch West Indian vs Immigrants from Cabo Verde Unemployment Among Ages 30 to 34 years Correlation Chart
The statistical analysis conducted on geographies consisting of 82,832,966 people shows a very strong positive correlation between the proportion of Dutch West Indians and unemployment rate among population between the ages 30 and 34 in the United States with a correlation coefficient (R) of 0.835 and weighted average of 6.6%. Similarly, the statistical analysis conducted on geographies consisting of 37,388,192 people shows a poor positive correlation between the proportion of Immigrants from Cabo Verde and unemployment rate among population between the ages 30 and 34 in the United States with a correlation coefficient (R) of 0.176 and weighted average of 7.2%, a difference of 9.0%.
Unemployment Among Ages 30 to 34 years Correlation Summary
| Measurement | Dutch West Indian | Immigrants from Cabo Verde |
| Minimum | 5.7% | 1.8% |
| Maximum | 100.0% | 15.2% |
| Range | 94.3% | 13.4% |
| Mean | 22.0% | 6.8% |
| Median | 13.2% | 6.5% |
| Interquartile 25% (IQ1) | 8.7% | 4.7% |
| Interquartile 75% (IQ3) | 28.9% | 8.3% |
| Interquartile Range (IQR) | 20.3% | 3.6% |
| Standard Deviation (Sample) | 24.0% | 2.6% |
| Standard Deviation (Population) | 23.2% | 2.6% |
Demographics Similar to Dutch West Indians and Immigrants from Cabo Verde by Unemployment Among Ages 30 to 34 years
In terms of unemployment among ages 30 to 34 years, the demographic groups most similar to Dutch West Indians are Bahamian (6.6%, a difference of 0.050%), Immigrants from Barbados (6.6%, a difference of 0.10%), Belizean (6.6%, a difference of 0.34%), Delaware (6.7%, a difference of 1.2%), and Cajun (6.7%, a difference of 1.4%). Similarly, the demographic groups most similar to Immigrants from Cabo Verde are Black/African American (7.2%, a difference of 0.10%), Houma (7.2%, a difference of 0.27%), Aleut (7.1%, a difference of 1.3%), Lumbee (7.1%, a difference of 1.7%), and Ute (7.0%, a difference of 1.9%).
| Demographics | Rating | Rank | Unemployment Among Ages 30 to 34 years |
| Immigrants | Barbados | 0.0 /100 | #298 | Tragic 6.6% |
| Dutch West Indians | 0.0 /100 | #299 | Tragic 6.6% |
| Bahamians | 0.0 /100 | #300 | Tragic 6.6% |
| Belizeans | 0.0 /100 | #301 | Tragic 6.6% |
| Delaware | 0.0 /100 | #302 | Tragic 6.7% |
| Cajuns | 0.0 /100 | #303 | Tragic 6.7% |
| Kiowa | 0.0 /100 | #304 | Tragic 6.7% |
| Paiute | 0.0 /100 | #305 | Tragic 6.7% |
| Immigrants | Armenia | 0.0 /100 | #306 | Tragic 6.8% |
| Immigrants | Belize | 0.0 /100 | #307 | Tragic 6.9% |
| Immigrants | Azores | 0.0 /100 | #308 | Tragic 6.9% |
| Immigrants | Grenada | 0.0 /100 | #309 | Tragic 6.9% |
| Immigrants | St. Vincent and the Grenadines | 0.0 /100 | #310 | Tragic 7.0% |
| Alaskan Athabascans | 0.0 /100 | #311 | Tragic 7.0% |
| British West Indians | 0.0 /100 | #312 | Tragic 7.0% |
| Ute | 0.0 /100 | #313 | Tragic 7.0% |
| Lumbee | 0.0 /100 | #314 | Tragic 7.1% |
| Aleuts | 0.0 /100 | #315 | Tragic 7.1% |
| Houma | 0.0 /100 | #316 | Tragic 7.2% |
| Immigrants | Cabo Verde | 0.0 /100 | #317 | Tragic 7.2% |
| Blacks/African Americans | 0.0 /100 | #318 | Tragic 7.2% |