Immigrants from Jamaica vs Immigrants from Cabo Verde Unemployment Among Ages 30 to 34 years
COMPARE
Immigrants from Jamaica
Immigrants from Cabo Verde
Unemployment Among Ages 30 to 34 years
Unemployment Among Ages 30 to 34 years Comparison
Immigrants from Jamaica
Immigrants from Cabo Verde
6.5%
UNEMPLOYMENT AMONG AGES 30 TO 34 YEARS
0.0/ 100
METRIC RATING
296th/ 347
METRIC RANK
7.2%
UNEMPLOYMENT AMONG AGES 30 TO 34 YEARS
0.0/ 100
METRIC RATING
317th/ 347
METRIC RANK
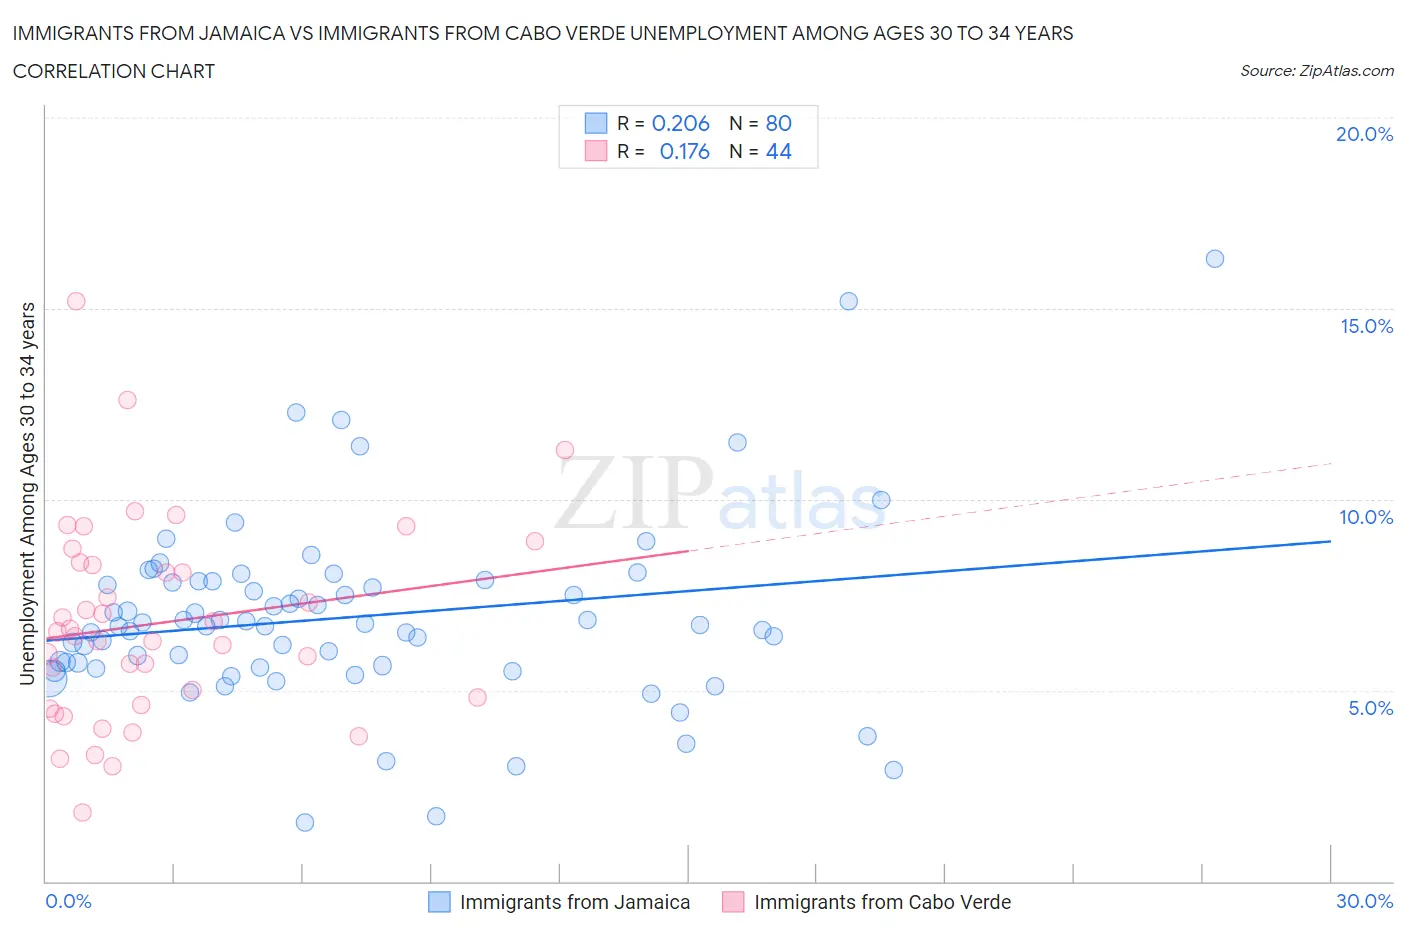
Immigrants from Jamaica vs Immigrants from Cabo Verde Unemployment Among Ages 30 to 34 years Correlation Chart
The statistical analysis conducted on geographies consisting of 289,463,038 people shows a weak positive correlation between the proportion of Immigrants from Jamaica and unemployment rate among population between the ages 30 and 34 in the United States with a correlation coefficient (R) of 0.206 and weighted average of 6.5%. Similarly, the statistical analysis conducted on geographies consisting of 37,388,192 people shows a poor positive correlation between the proportion of Immigrants from Cabo Verde and unemployment rate among population between the ages 30 and 34 in the United States with a correlation coefficient (R) of 0.176 and weighted average of 7.2%, a difference of 9.5%.
Unemployment Among Ages 30 to 34 years Correlation Summary
| Measurement | Immigrants from Jamaica | Immigrants from Cabo Verde |
| Minimum | 1.5% | 1.8% |
| Maximum | 16.3% | 15.2% |
| Range | 14.8% | 13.4% |
| Mean | 6.9% | 6.8% |
| Median | 6.7% | 6.5% |
| Interquartile 25% (IQ1) | 5.6% | 4.7% |
| Interquartile 75% (IQ3) | 7.8% | 8.3% |
| Interquartile Range (IQR) | 2.2% | 3.6% |
| Standard Deviation (Sample) | 2.4% | 2.6% |
| Standard Deviation (Population) | 2.4% | 2.6% |
Similar Demographics by Unemployment Among Ages 30 to 34 years
Demographics Similar to Immigrants from Jamaica by Unemployment Among Ages 30 to 34 years
In terms of unemployment among ages 30 to 34 years, the demographic groups most similar to Immigrants from Jamaica are Trinidadian and Tobagonian (6.5%, a difference of 0.050%), Creek (6.6%, a difference of 0.10%), Barbadian (6.5%, a difference of 0.29%), Immigrants from Barbados (6.6%, a difference of 0.35%), and Dutch West Indian (6.6%, a difference of 0.45%).
| Demographics | Rating | Rank | Unemployment Among Ages 30 to 34 years |
| Menominee | 0.0 /100 | #289 | Tragic 6.4% |
| Immigrants | Trinidad and Tobago | 0.0 /100 | #290 | Tragic 6.5% |
| Jamaicans | 0.0 /100 | #291 | Tragic 6.5% |
| Vietnamese | 0.0 /100 | #292 | Tragic 6.5% |
| West Indians | 0.0 /100 | #293 | Tragic 6.5% |
| Barbadians | 0.0 /100 | #294 | Tragic 6.5% |
| Trinidadians and Tobagonians | 0.0 /100 | #295 | Tragic 6.5% |
| Immigrants | Jamaica | 0.0 /100 | #296 | Tragic 6.5% |
| Creek | 0.0 /100 | #297 | Tragic 6.6% |
| Immigrants | Barbados | 0.0 /100 | #298 | Tragic 6.6% |
| Dutch West Indians | 0.0 /100 | #299 | Tragic 6.6% |
| Bahamians | 0.0 /100 | #300 | Tragic 6.6% |
| Belizeans | 0.0 /100 | #301 | Tragic 6.6% |
| Delaware | 0.0 /100 | #302 | Tragic 6.7% |
| Cajuns | 0.0 /100 | #303 | Tragic 6.7% |
Demographics Similar to Immigrants from Cabo Verde by Unemployment Among Ages 30 to 34 years
In terms of unemployment among ages 30 to 34 years, the demographic groups most similar to Immigrants from Cabo Verde are Black/African American (7.2%, a difference of 0.10%), Guyanese (7.2%, a difference of 0.16%), Cape Verdean (7.2%, a difference of 0.19%), Houma (7.2%, a difference of 0.27%), and Immigrants from Guyana (7.2%, a difference of 0.48%).
| Demographics | Rating | Rank | Unemployment Among Ages 30 to 34 years |
| Immigrants | St. Vincent and the Grenadines | 0.0 /100 | #310 | Tragic 7.0% |
| Alaskan Athabascans | 0.0 /100 | #311 | Tragic 7.0% |
| British West Indians | 0.0 /100 | #312 | Tragic 7.0% |
| Ute | 0.0 /100 | #313 | Tragic 7.0% |
| Lumbee | 0.0 /100 | #314 | Tragic 7.1% |
| Aleuts | 0.0 /100 | #315 | Tragic 7.1% |
| Houma | 0.0 /100 | #316 | Tragic 7.2% |
| Immigrants | Cabo Verde | 0.0 /100 | #317 | Tragic 7.2% |
| Blacks/African Americans | 0.0 /100 | #318 | Tragic 7.2% |
| Guyanese | 0.0 /100 | #319 | Tragic 7.2% |
| Cape Verdeans | 0.0 /100 | #320 | Tragic 7.2% |
| Immigrants | Guyana | 0.0 /100 | #321 | Tragic 7.2% |
| Marshallese | 0.0 /100 | #322 | Tragic 7.2% |
| Immigrants | Yemen | 0.0 /100 | #323 | Tragic 7.3% |
| Immigrants | Dominica | 0.0 /100 | #324 | Tragic 7.3% |