Dutch West Indian vs Paraguayan Unemployment Among Ages 30 to 34 years
COMPARE
Dutch West Indian
Paraguayan
Unemployment Among Ages 30 to 34 years
Unemployment Among Ages 30 to 34 years Comparison
Dutch West Indians
Paraguayans
6.6%
UNEMPLOYMENT AMONG AGES 30 TO 34 YEARS
0.0/ 100
METRIC RATING
299th/ 347
METRIC RANK
5.1%
UNEMPLOYMENT AMONG AGES 30 TO 34 YEARS
96.4/ 100
METRIC RATING
71st/ 347
METRIC RANK
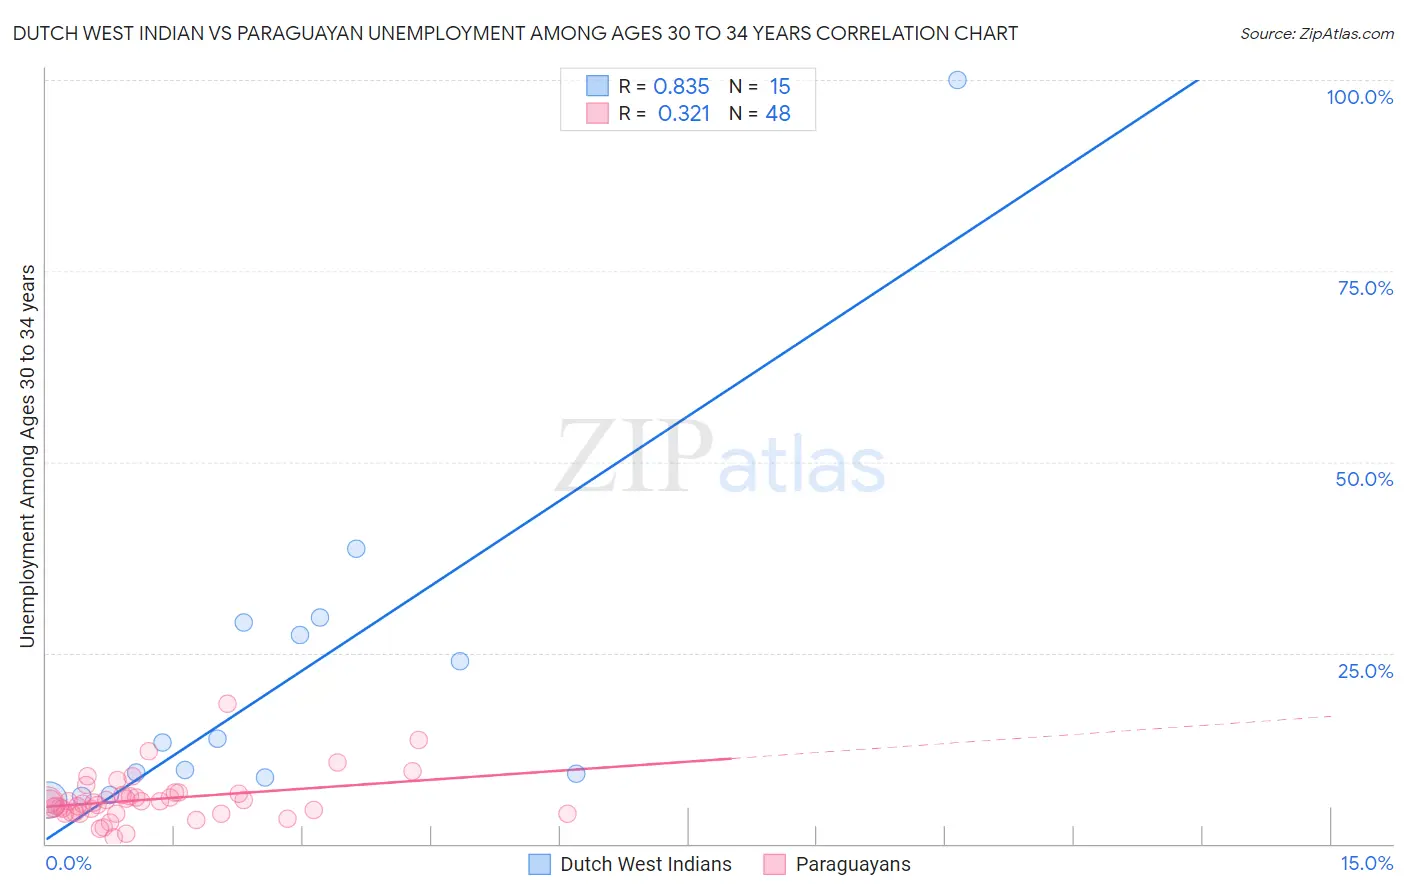
Dutch West Indian vs Paraguayan Unemployment Among Ages 30 to 34 years Correlation Chart
The statistical analysis conducted on geographies consisting of 82,832,966 people shows a very strong positive correlation between the proportion of Dutch West Indians and unemployment rate among population between the ages 30 and 34 in the United States with a correlation coefficient (R) of 0.835 and weighted average of 6.6%. Similarly, the statistical analysis conducted on geographies consisting of 93,376,287 people shows a mild positive correlation between the proportion of Paraguayans and unemployment rate among population between the ages 30 and 34 in the United States with a correlation coefficient (R) of 0.321 and weighted average of 5.1%, a difference of 27.8%.
Unemployment Among Ages 30 to 34 years Correlation Summary
| Measurement | Dutch West Indian | Paraguayan |
| Minimum | 5.7% | 0.90% |
| Maximum | 100.0% | 18.3% |
| Range | 94.3% | 17.4% |
| Mean | 22.0% | 5.8% |
| Median | 13.2% | 5.3% |
| Interquartile 25% (IQ1) | 8.7% | 4.0% |
| Interquartile 75% (IQ3) | 28.9% | 6.5% |
| Interquartile Range (IQR) | 20.3% | 2.5% |
| Standard Deviation (Sample) | 24.0% | 3.1% |
| Standard Deviation (Population) | 23.2% | 3.1% |
Similar Demographics by Unemployment Among Ages 30 to 34 years
Demographics Similar to Dutch West Indians by Unemployment Among Ages 30 to 34 years
In terms of unemployment among ages 30 to 34 years, the demographic groups most similar to Dutch West Indians are Bahamian (6.6%, a difference of 0.050%), Immigrants from Barbados (6.6%, a difference of 0.10%), Belizean (6.6%, a difference of 0.34%), Creek (6.6%, a difference of 0.35%), and Immigrants from Jamaica (6.5%, a difference of 0.45%).
| Demographics | Rating | Rank | Unemployment Among Ages 30 to 34 years |
| Vietnamese | 0.0 /100 | #292 | Tragic 6.5% |
| West Indians | 0.0 /100 | #293 | Tragic 6.5% |
| Barbadians | 0.0 /100 | #294 | Tragic 6.5% |
| Trinidadians and Tobagonians | 0.0 /100 | #295 | Tragic 6.5% |
| Immigrants | Jamaica | 0.0 /100 | #296 | Tragic 6.5% |
| Creek | 0.0 /100 | #297 | Tragic 6.6% |
| Immigrants | Barbados | 0.0 /100 | #298 | Tragic 6.6% |
| Dutch West Indians | 0.0 /100 | #299 | Tragic 6.6% |
| Bahamians | 0.0 /100 | #300 | Tragic 6.6% |
| Belizeans | 0.0 /100 | #301 | Tragic 6.6% |
| Delaware | 0.0 /100 | #302 | Tragic 6.7% |
| Cajuns | 0.0 /100 | #303 | Tragic 6.7% |
| Kiowa | 0.0 /100 | #304 | Tragic 6.7% |
| Paiute | 0.0 /100 | #305 | Tragic 6.7% |
| Immigrants | Armenia | 0.0 /100 | #306 | Tragic 6.8% |
Demographics Similar to Paraguayans by Unemployment Among Ages 30 to 34 years
In terms of unemployment among ages 30 to 34 years, the demographic groups most similar to Paraguayans are Immigrants from Iraq (5.1%, a difference of 0.0%), Immigrants from Northern Africa (5.1%, a difference of 0.010%), Immigrants from Moldova (5.1%, a difference of 0.010%), Jordanian (5.1%, a difference of 0.020%), and Burmese (5.1%, a difference of 0.030%).
| Demographics | Rating | Rank | Unemployment Among Ages 30 to 34 years |
| Immigrants | Eastern Asia | 96.9 /100 | #64 | Exceptional 5.1% |
| Immigrants | Japan | 96.8 /100 | #65 | Exceptional 5.1% |
| Immigrants | Zimbabwe | 96.7 /100 | #66 | Exceptional 5.1% |
| Burmese | 96.5 /100 | #67 | Exceptional 5.1% |
| Jordanians | 96.5 /100 | #68 | Exceptional 5.1% |
| Immigrants | Northern Africa | 96.4 /100 | #69 | Exceptional 5.1% |
| Immigrants | Iraq | 96.4 /100 | #70 | Exceptional 5.1% |
| Paraguayans | 96.4 /100 | #71 | Exceptional 5.1% |
| Immigrants | Moldova | 96.4 /100 | #72 | Exceptional 5.1% |
| Slovenes | 96.2 /100 | #73 | Exceptional 5.2% |
| Immigrants | Asia | 96.2 /100 | #74 | Exceptional 5.2% |
| Iranians | 96.0 /100 | #75 | Exceptional 5.2% |
| Scandinavians | 95.6 /100 | #76 | Exceptional 5.2% |
| Uruguayans | 95.4 /100 | #77 | Exceptional 5.2% |
| Indonesians | 95.1 /100 | #78 | Exceptional 5.2% |