British West Indian vs Alaska Native Unemployment Among Ages 60 to 64 years
COMPARE
British West Indian
Alaska Native
Unemployment Among Ages 60 to 64 years
Unemployment Among Ages 60 to 64 years Comparison
British West Indians
Alaska Natives
5.5%
UNEMPLOYMENT AMONG AGES 60 TO 64 YEARS
0.0/ 100
METRIC RATING
310th/ 347
METRIC RANK
7.6%
UNEMPLOYMENT AMONG AGES 60 TO 64 YEARS
0.0/ 100
METRIC RATING
344th/ 347
METRIC RANK
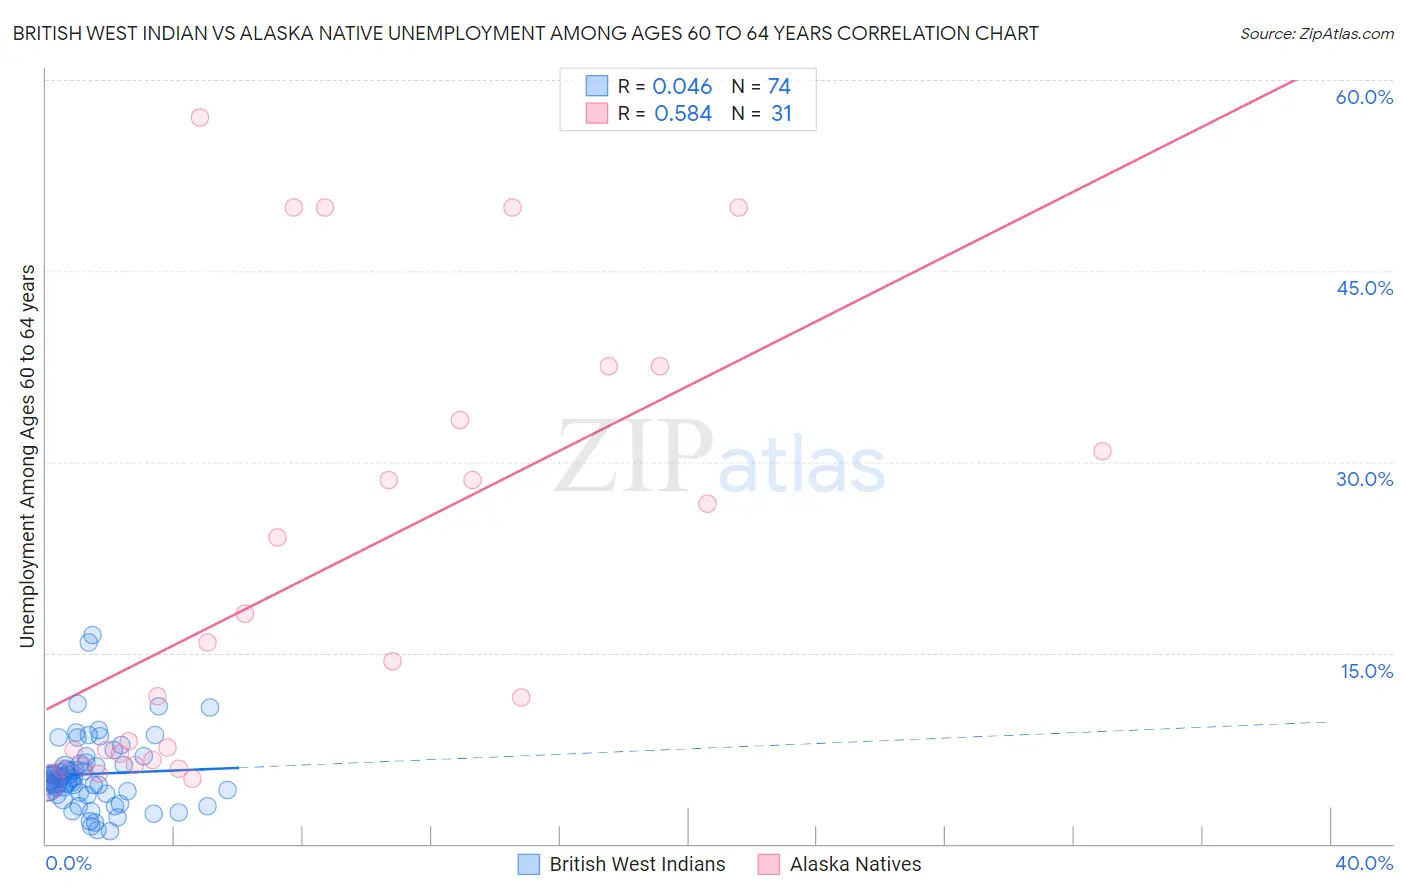
British West Indian vs Alaska Native Unemployment Among Ages 60 to 64 years Correlation Chart
The statistical analysis conducted on geographies consisting of 146,208,505 people shows no correlation between the proportion of British West Indians and unemployment rate among population between the ages 60 and 64 in the United States with a correlation coefficient (R) of 0.046 and weighted average of 5.5%. Similarly, the statistical analysis conducted on geographies consisting of 73,898,617 people shows a substantial positive correlation between the proportion of Alaska Natives and unemployment rate among population between the ages 60 and 64 in the United States with a correlation coefficient (R) of 0.584 and weighted average of 7.6%, a difference of 39.7%.
Unemployment Among Ages 60 to 64 years Correlation Summary
| Measurement | British West Indian | Alaska Native |
| Minimum | 1.0% | 4.8% |
| Maximum | 16.4% | 57.1% |
| Range | 15.4% | 52.3% |
| Mean | 5.5% | 21.3% |
| Median | 5.1% | 14.3% |
| Interquartile 25% (IQ1) | 4.0% | 6.5% |
| Interquartile 75% (IQ3) | 6.2% | 33.3% |
| Interquartile Range (IQR) | 2.2% | 26.8% |
| Standard Deviation (Sample) | 2.8% | 17.0% |
| Standard Deviation (Population) | 2.8% | 16.7% |
Similar Demographics by Unemployment Among Ages 60 to 64 years
Demographics Similar to British West Indians by Unemployment Among Ages 60 to 64 years
In terms of unemployment among ages 60 to 64 years, the demographic groups most similar to British West Indians are U.S. Virgin Islander (5.5%, a difference of 0.020%), Immigrants from West Indies (5.5%, a difference of 0.20%), Belizean (5.5%, a difference of 0.90%), Soviet Union (5.4%, a difference of 0.92%), and Spanish American Indian (5.4%, a difference of 0.93%).
| Demographics | Rating | Rank | Unemployment Among Ages 60 to 64 years |
| Bahamians | 0.0 /100 | #303 | Tragic 5.4% |
| Immigrants | Mexico | 0.0 /100 | #304 | Tragic 5.4% |
| Cypriots | 0.0 /100 | #305 | Tragic 5.4% |
| Immigrants | Dominica | 0.0 /100 | #306 | Tragic 5.4% |
| Immigrants | Guyana | 0.0 /100 | #307 | Tragic 5.4% |
| Spanish American Indians | 0.0 /100 | #308 | Tragic 5.4% |
| Soviet Union | 0.0 /100 | #309 | Tragic 5.4% |
| British West Indians | 0.0 /100 | #310 | Tragic 5.5% |
| U.S. Virgin Islanders | 0.0 /100 | #311 | Tragic 5.5% |
| Immigrants | West Indies | 0.0 /100 | #312 | Tragic 5.5% |
| Belizeans | 0.0 /100 | #313 | Tragic 5.5% |
| Guyanese | 0.0 /100 | #314 | Tragic 5.5% |
| Cree | 0.0 /100 | #315 | Tragic 5.6% |
| Cheyenne | 0.0 /100 | #316 | Tragic 5.6% |
| Shoshone | 0.0 /100 | #317 | Tragic 5.7% |
Demographics Similar to Alaska Natives by Unemployment Among Ages 60 to 64 years
In terms of unemployment among ages 60 to 64 years, the demographic groups most similar to Alaska Natives are Alaskan Athabascan (8.4%, a difference of 10.0%), Immigrants from Yemen (6.8%, a difference of 11.7%), Aleut (6.8%, a difference of 12.5%), Yuman (6.8%, a difference of 12.5%), and Pueblo (6.7%, a difference of 13.1%).
| Demographics | Rating | Rank | Unemployment Among Ages 60 to 64 years |
| Immigrants | Dominican Republic | 0.0 /100 | #333 | Tragic 6.0% |
| Puerto Ricans | 0.0 /100 | #334 | Tragic 6.1% |
| Vietnamese | 0.0 /100 | #335 | Tragic 6.1% |
| Kiowa | 0.0 /100 | #336 | Tragic 6.2% |
| Navajo | 0.0 /100 | #337 | Tragic 6.3% |
| Arapaho | 0.0 /100 | #338 | Tragic 6.3% |
| Tlingit-Haida | 0.0 /100 | #339 | Tragic 6.4% |
| Pueblo | 0.0 /100 | #340 | Tragic 6.7% |
| Yuman | 0.0 /100 | #341 | Tragic 6.8% |
| Aleuts | 0.0 /100 | #342 | Tragic 6.8% |
| Immigrants | Yemen | 0.0 /100 | #343 | Tragic 6.8% |
| Alaska Natives | 0.0 /100 | #344 | Tragic 7.6% |
| Alaskan Athabascans | 0.0 /100 | #345 | Tragic 8.4% |
| Inupiat | 0.0 /100 | #346 | Tragic 9.6% |
| Yup'ik | 0.0 /100 | #347 | Tragic 11.9% |