Dutch West Indian vs Immigrants from West Indies Unemployment Among Ages 60 to 64 years
COMPARE
Dutch West Indian
Immigrants from West Indies
Unemployment Among Ages 60 to 64 years
Unemployment Among Ages 60 to 64 years Comparison
Dutch West Indians
Immigrants from West Indies
5.7%
UNEMPLOYMENT AMONG AGES 60 TO 64 YEARS
0.0/ 100
METRIC RATING
321st/ 347
METRIC RANK
5.5%
UNEMPLOYMENT AMONG AGES 60 TO 64 YEARS
0.0/ 100
METRIC RATING
312th/ 347
METRIC RANK
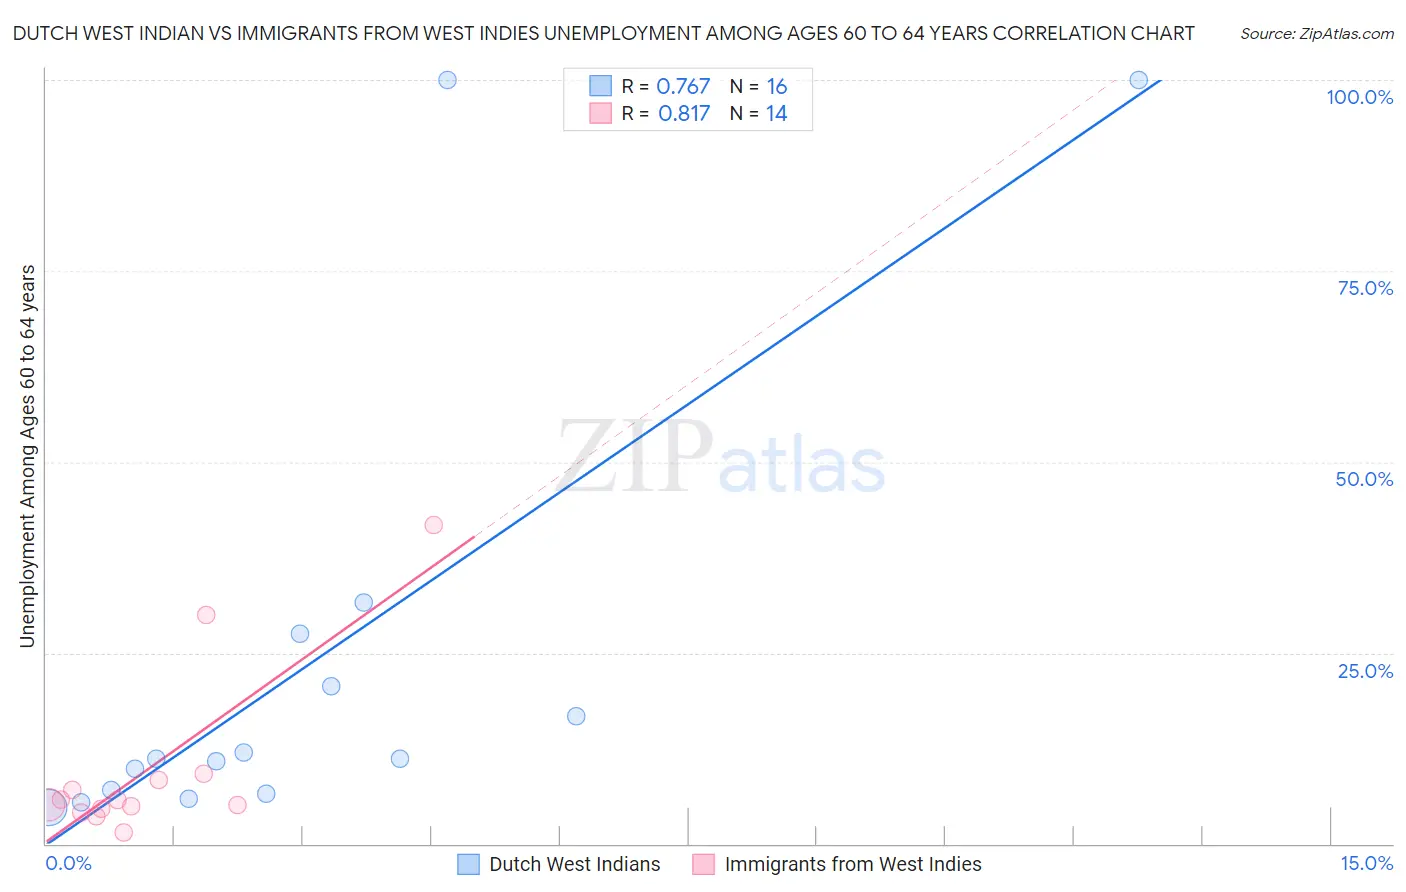
Dutch West Indian vs Immigrants from West Indies Unemployment Among Ages 60 to 64 years Correlation Chart
The statistical analysis conducted on geographies consisting of 80,557,093 people shows a strong positive correlation between the proportion of Dutch West Indians and unemployment rate among population between the ages 60 and 64 in the United States with a correlation coefficient (R) of 0.767 and weighted average of 5.7%. Similarly, the statistical analysis conducted on geographies consisting of 71,195,820 people shows a very strong positive correlation between the proportion of Immigrants from West Indies and unemployment rate among population between the ages 60 and 64 in the United States with a correlation coefficient (R) of 0.817 and weighted average of 5.5%, a difference of 4.8%.
Unemployment Among Ages 60 to 64 years Correlation Summary
| Measurement | Dutch West Indian | Immigrants from West Indies |
| Minimum | 4.8% | 1.4% |
| Maximum | 100.0% | 41.7% |
| Range | 95.2% | 40.3% |
| Mean | 23.8% | 9.8% |
| Median | 11.1% | 5.4% |
| Interquartile 25% (IQ1) | 6.8% | 4.7% |
| Interquartile 75% (IQ3) | 24.1% | 8.4% |
| Interquartile Range (IQR) | 17.3% | 3.8% |
| Standard Deviation (Sample) | 30.7% | 11.4% |
| Standard Deviation (Population) | 29.8% | 11.0% |
Demographics Similar to Dutch West Indians and Immigrants from West Indies by Unemployment Among Ages 60 to 64 years
In terms of unemployment among ages 60 to 64 years, the demographic groups most similar to Dutch West Indians are Colville (5.7%, a difference of 0.050%), Ecuadorian (5.8%, a difference of 0.39%), Immigrants from Belize (5.7%, a difference of 0.82%), Alsatian (5.8%, a difference of 1.0%), and Native/Alaskan (5.7%, a difference of 1.3%). Similarly, the demographic groups most similar to Immigrants from West Indies are U.S. Virgin Islander (5.5%, a difference of 0.19%), British West Indian (5.5%, a difference of 0.20%), Belizean (5.5%, a difference of 0.70%), Guyanese (5.5%, a difference of 0.87%), and Soviet Union (5.4%, a difference of 1.1%).
| Demographics | Rating | Rank | Unemployment Among Ages 60 to 64 years |
| Immigrants | Dominica | 0.0 /100 | #306 | Tragic 5.4% |
| Immigrants | Guyana | 0.0 /100 | #307 | Tragic 5.4% |
| Spanish American Indians | 0.0 /100 | #308 | Tragic 5.4% |
| Soviet Union | 0.0 /100 | #309 | Tragic 5.4% |
| British West Indians | 0.0 /100 | #310 | Tragic 5.5% |
| U.S. Virgin Islanders | 0.0 /100 | #311 | Tragic 5.5% |
| Immigrants | West Indies | 0.0 /100 | #312 | Tragic 5.5% |
| Belizeans | 0.0 /100 | #313 | Tragic 5.5% |
| Guyanese | 0.0 /100 | #314 | Tragic 5.5% |
| Cree | 0.0 /100 | #315 | Tragic 5.6% |
| Cheyenne | 0.0 /100 | #316 | Tragic 5.6% |
| Shoshone | 0.0 /100 | #317 | Tragic 5.7% |
| Natives/Alaskans | 0.0 /100 | #318 | Tragic 5.7% |
| Immigrants | Belize | 0.0 /100 | #319 | Tragic 5.7% |
| Colville | 0.0 /100 | #320 | Tragic 5.7% |
| Dutch West Indians | 0.0 /100 | #321 | Tragic 5.7% |
| Ecuadorians | 0.0 /100 | #322 | Tragic 5.8% |
| Alsatians | 0.0 /100 | #323 | Tragic 5.8% |
| Immigrants | Ecuador | 0.0 /100 | #324 | Tragic 5.8% |
| Paiute | 0.0 /100 | #325 | Tragic 5.8% |
| Immigrants | St. Vincent and the Grenadines | 0.0 /100 | #326 | Tragic 5.9% |