Dutch vs Cree Female Unemployment
COMPARE
Dutch
Cree
Female Unemployment
Female Unemployment Comparison
Dutch
Cree
4.6%
FEMALE UNEMPLOYMENT
100.0/ 100
METRIC RATING
12th/ 347
METRIC RANK
5.6%
FEMALE UNEMPLOYMENT
1.0/ 100
METRIC RATING
248th/ 347
METRIC RANK
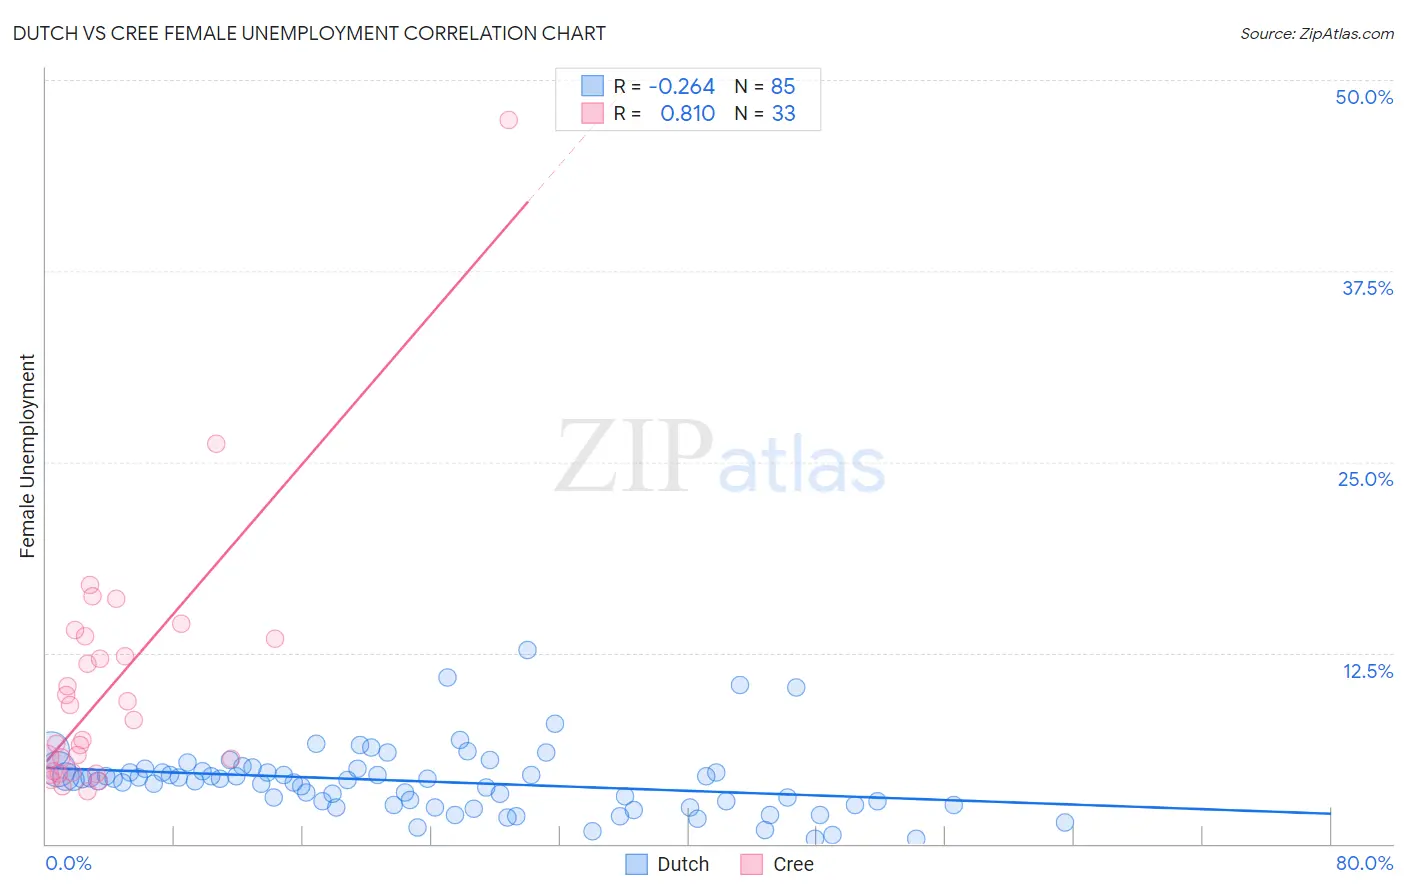
Dutch vs Cree Female Unemployment Correlation Chart
The statistical analysis conducted on geographies consisting of 542,310,807 people shows a weak negative correlation between the proportion of Dutch and unemploymnet rate among females in the United States with a correlation coefficient (R) of -0.264 and weighted average of 4.6%. Similarly, the statistical analysis conducted on geographies consisting of 76,053,409 people shows a very strong positive correlation between the proportion of Cree and unemploymnet rate among females in the United States with a correlation coefficient (R) of 0.810 and weighted average of 5.6%, a difference of 22.4%.
Female Unemployment Correlation Summary
| Measurement | Dutch | Cree |
| Minimum | 0.30% | 3.4% |
| Maximum | 12.7% | 47.4% |
| Range | 12.4% | 44.0% |
| Mean | 4.1% | 10.4% |
| Median | 4.2% | 8.1% |
| Interquartile 25% (IQ1) | 2.5% | 4.7% |
| Interquartile 75% (IQ3) | 4.8% | 13.5% |
| Interquartile Range (IQR) | 2.3% | 8.8% |
| Standard Deviation (Sample) | 2.2% | 8.4% |
| Standard Deviation (Population) | 2.2% | 8.3% |
Similar Demographics by Female Unemployment
Demographics Similar to Dutch by Female Unemployment
In terms of female unemployment, the demographic groups most similar to Dutch are Belgian (4.6%, a difference of 0.15%), Scandinavian (4.6%, a difference of 0.59%), Swiss (4.6%, a difference of 0.71%), Finnish (4.6%, a difference of 0.75%), and English (4.6%, a difference of 0.94%).
| Demographics | Rating | Rank | Female Unemployment |
| Hmong | 100.0 /100 | #5 | Exceptional 4.4% |
| Swedes | 100.0 /100 | #6 | Exceptional 4.4% |
| Chinese | 100.0 /100 | #7 | Exceptional 4.5% |
| Germans | 100.0 /100 | #8 | Exceptional 4.5% |
| Slovenes | 100.0 /100 | #9 | Exceptional 4.5% |
| Swiss | 100.0 /100 | #10 | Exceptional 4.6% |
| Scandinavians | 100.0 /100 | #11 | Exceptional 4.6% |
| Dutch | 100.0 /100 | #12 | Exceptional 4.6% |
| Belgians | 100.0 /100 | #13 | Exceptional 4.6% |
| Finns | 100.0 /100 | #14 | Exceptional 4.6% |
| English | 100.0 /100 | #15 | Exceptional 4.6% |
| Carpatho Rusyns | 99.9 /100 | #16 | Exceptional 4.7% |
| Croatians | 99.9 /100 | #17 | Exceptional 4.7% |
| Latvians | 99.9 /100 | #18 | Exceptional 4.7% |
| Poles | 99.9 /100 | #19 | Exceptional 4.7% |
Demographics Similar to Cree by Female Unemployment
In terms of female unemployment, the demographic groups most similar to Cree are Immigrants from Uzbekistan (5.6%, a difference of 0.040%), Immigrants from Western Asia (5.6%, a difference of 0.16%), Japanese (5.6%, a difference of 0.24%), Immigrants from Syria (5.6%, a difference of 0.33%), and Assyrian/Chaldean/Syriac (5.6%, a difference of 0.39%).
| Demographics | Rating | Rank | Female Unemployment |
| South American Indians | 2.8 /100 | #241 | Tragic 5.5% |
| Marshallese | 2.3 /100 | #242 | Tragic 5.6% |
| Spanish Americans | 2.2 /100 | #243 | Tragic 5.6% |
| Immigrants | Liberia | 1.5 /100 | #244 | Tragic 5.6% |
| Guamanians/Chamorros | 1.4 /100 | #245 | Tragic 5.6% |
| Japanese | 1.2 /100 | #246 | Tragic 5.6% |
| Immigrants | Western Asia | 1.1 /100 | #247 | Tragic 5.6% |
| Cree | 1.0 /100 | #248 | Tragic 5.6% |
| Immigrants | Uzbekistan | 1.0 /100 | #249 | Tragic 5.6% |
| Immigrants | Syria | 0.8 /100 | #250 | Tragic 5.6% |
| Assyrians/Chaldeans/Syriacs | 0.8 /100 | #251 | Tragic 5.6% |
| Cajuns | 0.7 /100 | #252 | Tragic 5.7% |
| Immigrants | Sierra Leone | 0.6 /100 | #253 | Tragic 5.7% |
| Immigrants | Immigrants | 0.6 /100 | #254 | Tragic 5.7% |
| Immigrants | Cameroon | 0.6 /100 | #255 | Tragic 5.7% |