Dominican vs Immigrants from Serbia Unemployment Among Women with Children Ages 6 to 17 years
COMPARE
Dominican
Immigrants from Serbia
Unemployment Among Women with Children Ages 6 to 17 years
Unemployment Among Women with Children Ages 6 to 17 years Comparison
Dominicans
Immigrants from Serbia
10.8%
UNEMPLOYMENT AMONG WOMEN WITH CHILDREN AGES 6 TO 17 YEARS
0.0/ 100
METRIC RATING
323rd/ 347
METRIC RANK
8.6%
UNEMPLOYMENT AMONG WOMEN WITH CHILDREN AGES 6 TO 17 YEARS
97.7/ 100
METRIC RATING
106th/ 347
METRIC RANK
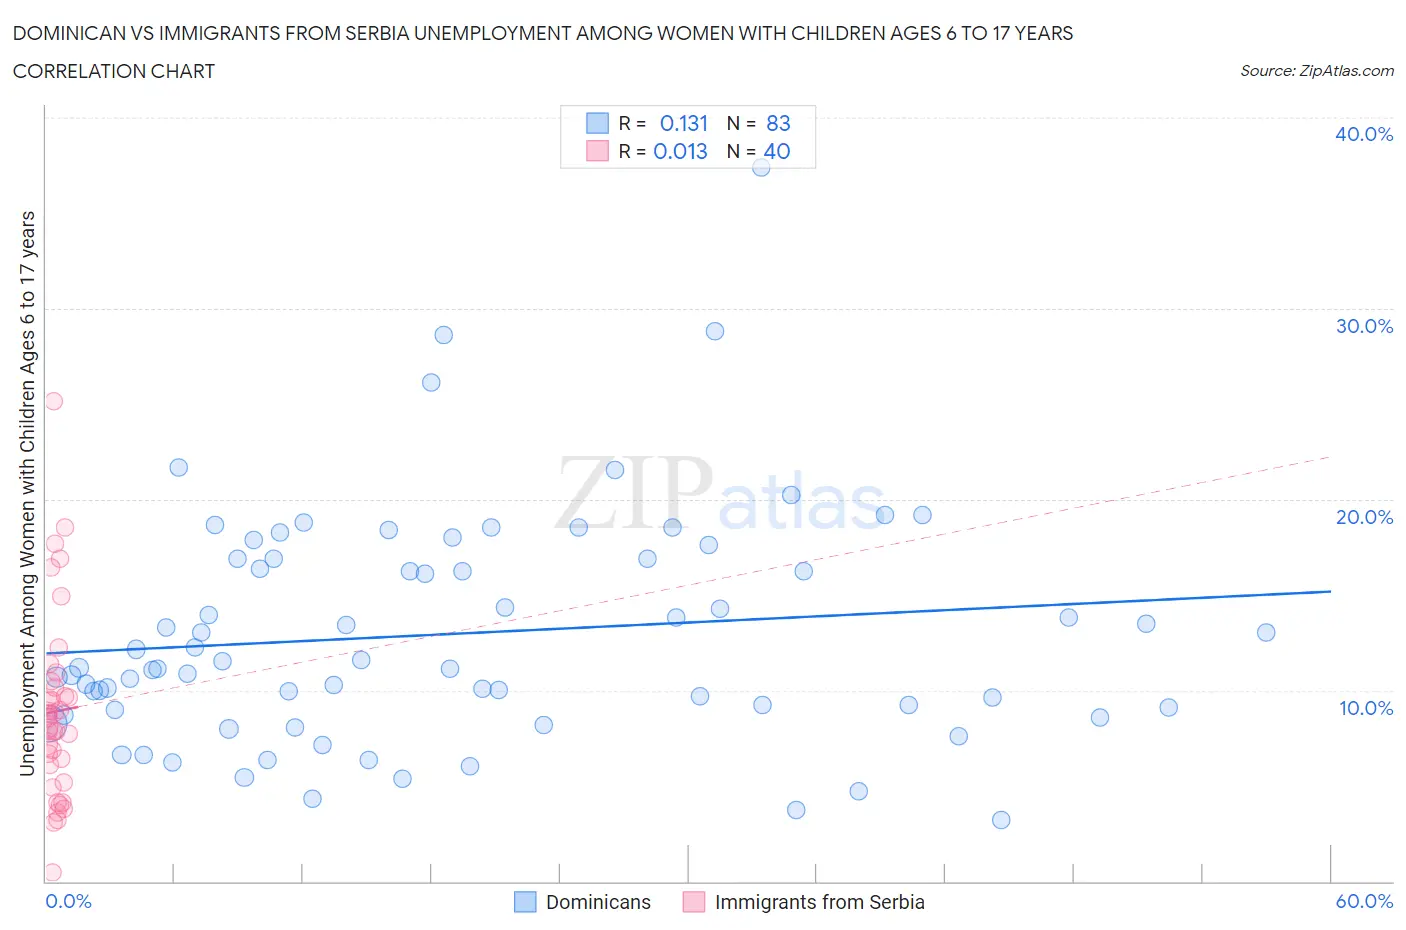
Dominican vs Immigrants from Serbia Unemployment Among Women with Children Ages 6 to 17 years Correlation Chart
The statistical analysis conducted on geographies consisting of 262,781,986 people shows a poor positive correlation between the proportion of Dominicans and unemployment rate among women with children between the ages 6 and 17 in the United States with a correlation coefficient (R) of 0.131 and weighted average of 10.8%. Similarly, the statistical analysis conducted on geographies consisting of 109,738,992 people shows no correlation between the proportion of Immigrants from Serbia and unemployment rate among women with children between the ages 6 and 17 in the United States with a correlation coefficient (R) of 0.013 and weighted average of 8.6%, a difference of 25.9%.
Unemployment Among Women with Children Ages 6 to 17 years Correlation Summary
| Measurement | Dominican | Immigrants from Serbia |
| Minimum | 3.2% | 0.44% |
| Maximum | 37.4% | 25.1% |
| Range | 34.2% | 24.7% |
| Mean | 13.0% | 8.9% |
| Median | 11.2% | 8.3% |
| Interquartile 25% (IQ1) | 9.0% | 5.6% |
| Interquartile 75% (IQ3) | 16.9% | 10.3% |
| Interquartile Range (IQR) | 7.9% | 4.7% |
| Standard Deviation (Sample) | 6.1% | 4.9% |
| Standard Deviation (Population) | 6.0% | 4.8% |
Similar Demographics by Unemployment Among Women with Children Ages 6 to 17 years
Demographics Similar to Dominicans by Unemployment Among Women with Children Ages 6 to 17 years
In terms of unemployment among women with children ages 6 to 17 years, the demographic groups most similar to Dominicans are Cree (10.8%, a difference of 0.050%), Immigrants from Dominican Republic (10.8%, a difference of 0.060%), Cajun (10.8%, a difference of 0.24%), Liberian (10.8%, a difference of 0.31%), and Cape Verdean (10.9%, a difference of 0.38%).
| Demographics | Rating | Rank | Unemployment Among Women with Children Ages 6 to 17 years |
| Immigrants | Dominica | 0.0 /100 | #316 | Tragic 10.5% |
| Bermudans | 0.0 /100 | #317 | Tragic 10.5% |
| Delaware | 0.0 /100 | #318 | Tragic 10.5% |
| Immigrants | Uganda | 0.0 /100 | #319 | Tragic 10.7% |
| Apache | 0.0 /100 | #320 | Tragic 10.7% |
| Tohono O'odham | 0.0 /100 | #321 | Tragic 10.7% |
| Cree | 0.0 /100 | #322 | Tragic 10.8% |
| Dominicans | 0.0 /100 | #323 | Tragic 10.8% |
| Immigrants | Dominican Republic | 0.0 /100 | #324 | Tragic 10.8% |
| Cajuns | 0.0 /100 | #325 | Tragic 10.8% |
| Liberians | 0.0 /100 | #326 | Tragic 10.8% |
| Cape Verdeans | 0.0 /100 | #327 | Tragic 10.9% |
| Ottawa | 0.0 /100 | #328 | Tragic 10.9% |
| Pennsylvania Germans | 0.0 /100 | #329 | Tragic 11.0% |
| Chippewa | 0.0 /100 | #330 | Tragic 11.1% |
Demographics Similar to Immigrants from Serbia by Unemployment Among Women with Children Ages 6 to 17 years
In terms of unemployment among women with children ages 6 to 17 years, the demographic groups most similar to Immigrants from Serbia are Chickasaw (8.6%, a difference of 0.030%), Immigrants from Norway (8.6%, a difference of 0.040%), Swedish (8.6%, a difference of 0.040%), Immigrants from Romania (8.6%, a difference of 0.11%), and Latvian (8.6%, a difference of 0.12%).
| Demographics | Rating | Rank | Unemployment Among Women with Children Ages 6 to 17 years |
| Immigrants | Lithuania | 98.4 /100 | #99 | Exceptional 8.6% |
| New Zealanders | 98.4 /100 | #100 | Exceptional 8.6% |
| Immigrants | Pakistan | 98.4 /100 | #101 | Exceptional 8.6% |
| Immigrants | South Africa | 98.3 /100 | #102 | Exceptional 8.6% |
| Scandinavians | 98.3 /100 | #103 | Exceptional 8.6% |
| Immigrants | France | 98.0 /100 | #104 | Exceptional 8.6% |
| Immigrants | Norway | 97.8 /100 | #105 | Exceptional 8.6% |
| Immigrants | Serbia | 97.7 /100 | #106 | Exceptional 8.6% |
| Chickasaw | 97.6 /100 | #107 | Exceptional 8.6% |
| Swedes | 97.6 /100 | #108 | Exceptional 8.6% |
| Immigrants | Romania | 97.5 /100 | #109 | Exceptional 8.6% |
| Latvians | 97.4 /100 | #110 | Exceptional 8.6% |
| Immigrants | Ukraine | 97.4 /100 | #111 | Exceptional 8.6% |
| Romanians | 97.1 /100 | #112 | Exceptional 8.6% |
| Eastern Europeans | 96.8 /100 | #113 | Exceptional 8.6% |