Immigrants from Guatemala vs Immigrants from Venezuela Male Unemployment
COMPARE
Immigrants from Guatemala
Immigrants from Venezuela
Male Unemployment
Male Unemployment Comparison
Immigrants from Guatemala
Immigrants from Venezuela
5.6%
MALE UNEMPLOYMENT
1.1/ 100
METRIC RATING
239th/ 347
METRIC RANK
4.4%
MALE UNEMPLOYMENT
100.0/ 100
METRIC RATING
4th/ 347
METRIC RANK
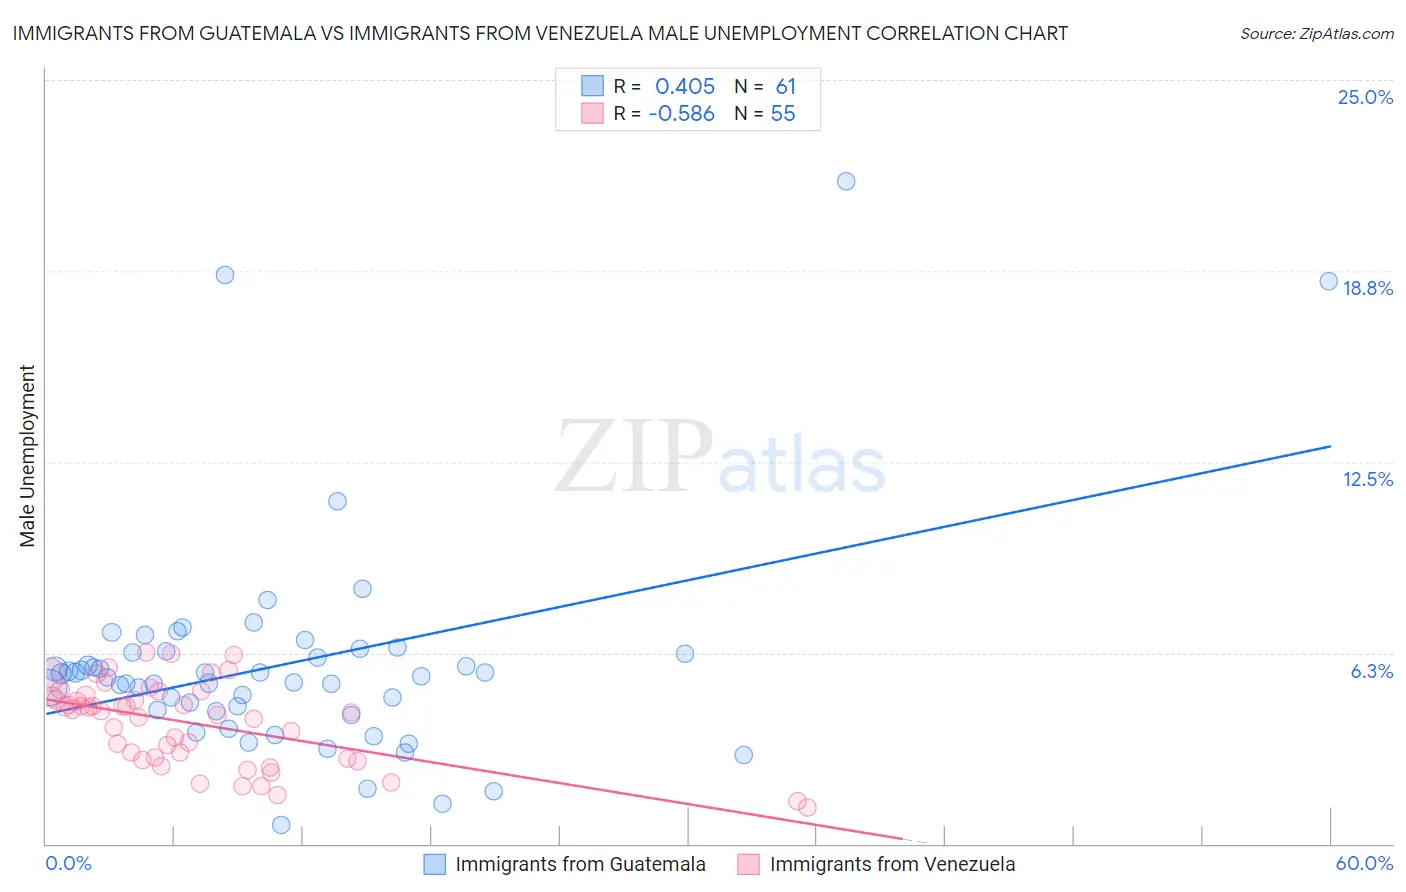
Immigrants from Guatemala vs Immigrants from Venezuela Male Unemployment Correlation Chart
The statistical analysis conducted on geographies consisting of 375,961,027 people shows a moderate positive correlation between the proportion of Immigrants from Guatemala and unemployment rate among males in the United States with a correlation coefficient (R) of 0.405 and weighted average of 5.6%. Similarly, the statistical analysis conducted on geographies consisting of 287,397,885 people shows a substantial negative correlation between the proportion of Immigrants from Venezuela and unemployment rate among males in the United States with a correlation coefficient (R) of -0.586 and weighted average of 4.4%, a difference of 26.9%.
Male Unemployment Correlation Summary
| Measurement | Immigrants from Guatemala | Immigrants from Venezuela |
| Minimum | 0.60% | 1.2% |
| Maximum | 21.7% | 6.3% |
| Range | 21.1% | 5.1% |
| Mean | 5.9% | 3.9% |
| Median | 5.5% | 4.3% |
| Interquartile 25% (IQ1) | 4.3% | 2.8% |
| Interquartile 75% (IQ3) | 6.3% | 4.9% |
| Interquartile Range (IQR) | 1.9% | 2.1% |
| Standard Deviation (Sample) | 3.6% | 1.3% |
| Standard Deviation (Population) | 3.6% | 1.3% |
Similar Demographics by Male Unemployment
Demographics Similar to Immigrants from Guatemala by Male Unemployment
In terms of male unemployment, the demographic groups most similar to Immigrants from Guatemala are Native Hawaiian (5.6%, a difference of 0.0%), Honduran (5.6%, a difference of 0.050%), Immigrants from Cameroon (5.6%, a difference of 0.070%), Salvadoran (5.7%, a difference of 0.11%), and Guatemalan (5.6%, a difference of 0.14%).
| Demographics | Rating | Rank | Male Unemployment |
| Moroccans | 1.6 /100 | #232 | Tragic 5.6% |
| Somalis | 1.5 /100 | #233 | Tragic 5.6% |
| Immigrants | Somalia | 1.5 /100 | #234 | Tragic 5.6% |
| Immigrants | Honduras | 1.5 /100 | #235 | Tragic 5.6% |
| Guatemalans | 1.2 /100 | #236 | Tragic 5.6% |
| Hondurans | 1.1 /100 | #237 | Tragic 5.6% |
| Native Hawaiians | 1.1 /100 | #238 | Tragic 5.6% |
| Immigrants | Guatemala | 1.1 /100 | #239 | Tragic 5.6% |
| Immigrants | Cameroon | 1.0 /100 | #240 | Tragic 5.6% |
| Salvadorans | 1.0 /100 | #241 | Tragic 5.7% |
| Ottawa | 0.9 /100 | #242 | Tragic 5.7% |
| Bangladeshis | 0.8 /100 | #243 | Tragic 5.7% |
| Immigrants | El Salvador | 0.7 /100 | #244 | Tragic 5.7% |
| Yaqui | 0.7 /100 | #245 | Tragic 5.7% |
| Iroquois | 0.6 /100 | #246 | Tragic 5.7% |
Demographics Similar to Immigrants from Venezuela by Male Unemployment
In terms of male unemployment, the demographic groups most similar to Immigrants from Venezuela are Norwegian (4.4%, a difference of 0.33%), Immigrants from Cuba (4.4%, a difference of 0.58%), Danish (4.5%, a difference of 1.0%), Venezuelan (4.5%, a difference of 1.5%), and Immigrants from India (4.4%, a difference of 1.7%).
| Demographics | Rating | Rank | Male Unemployment |
| Immigrants | India | 100.0 /100 | #1 | Exceptional 4.4% |
| Immigrants | Cuba | 100.0 /100 | #2 | Exceptional 4.4% |
| Norwegians | 100.0 /100 | #3 | Exceptional 4.4% |
| Immigrants | Venezuela | 100.0 /100 | #4 | Exceptional 4.4% |
| Danes | 100.0 /100 | #5 | Exceptional 4.5% |
| Venezuelans | 100.0 /100 | #6 | Exceptional 4.5% |
| Czechs | 100.0 /100 | #7 | Exceptional 4.5% |
| Luxembourgers | 100.0 /100 | #8 | Exceptional 4.5% |
| Thais | 100.0 /100 | #9 | Exceptional 4.6% |
| Cubans | 100.0 /100 | #10 | Exceptional 4.6% |
| Swedes | 100.0 /100 | #11 | Exceptional 4.6% |
| Immigrants | Bolivia | 100.0 /100 | #12 | Exceptional 4.7% |
| Bolivians | 100.0 /100 | #13 | Exceptional 4.7% |
| Germans | 100.0 /100 | #14 | Exceptional 4.7% |
| Scandinavians | 100.0 /100 | #15 | Exceptional 4.7% |