Delaware vs Immigrants from Lebanon Unemployment Among Ages 35 to 44 years
COMPARE
Delaware
Immigrants from Lebanon
Unemployment Among Ages 35 to 44 years
Unemployment Among Ages 35 to 44 years Comparison
Delaware
Immigrants from Lebanon
5.1%
UNEMPLOYMENT AMONG AGES 35 TO 44 YEARS
0.5/ 100
METRIC RATING
242nd/ 347
METRIC RANK
5.0%
UNEMPLOYMENT AMONG AGES 35 TO 44 YEARS
2.7/ 100
METRIC RATING
225th/ 347
METRIC RANK
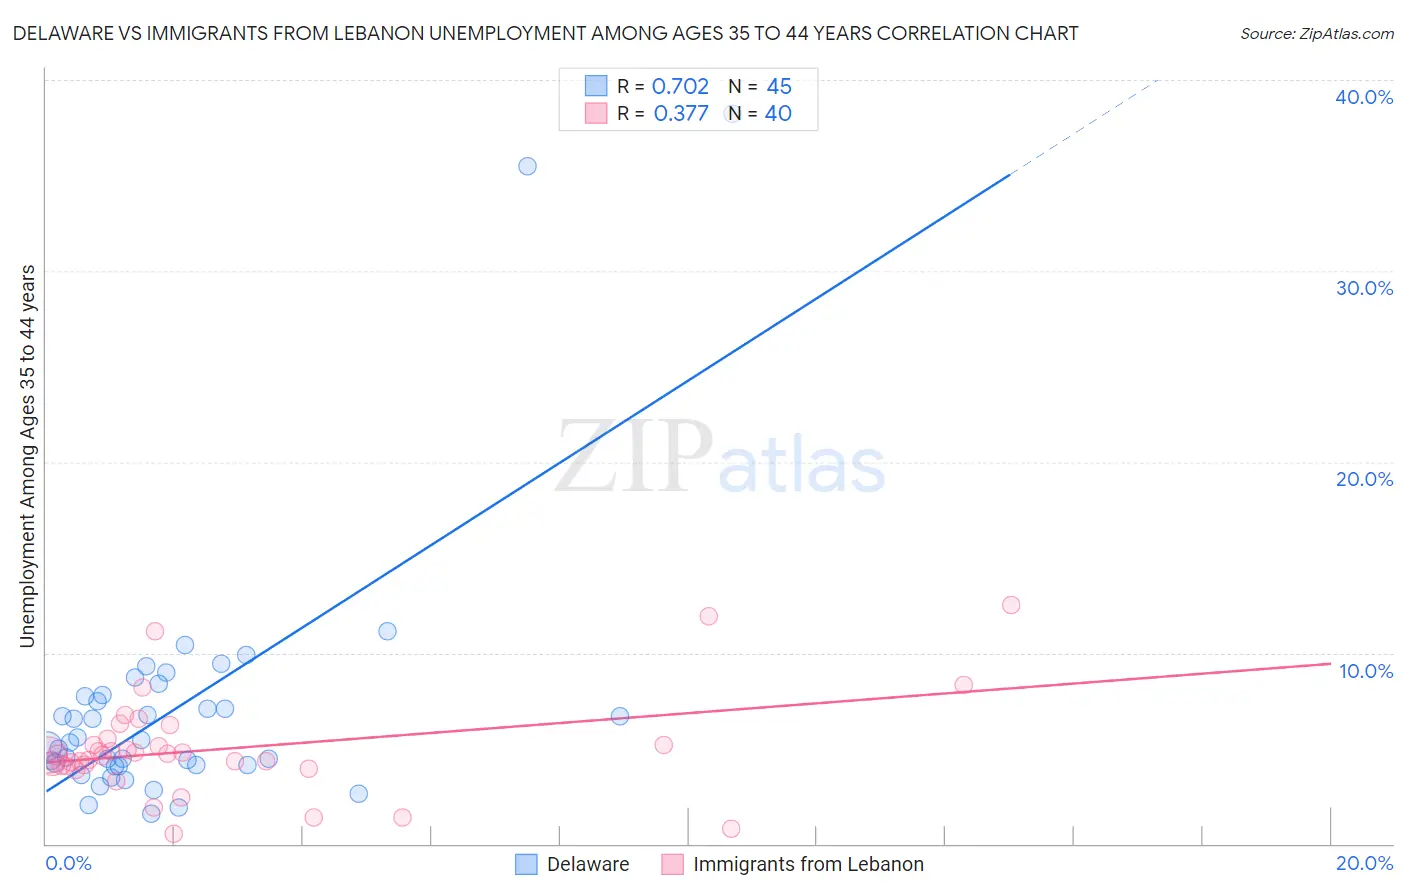
Delaware vs Immigrants from Lebanon Unemployment Among Ages 35 to 44 years Correlation Chart
The statistical analysis conducted on geographies consisting of 95,477,018 people shows a strong positive correlation between the proportion of Delaware and unemployment rate among population between the ages 35 and 44 in the United States with a correlation coefficient (R) of 0.702 and weighted average of 5.1%. Similarly, the statistical analysis conducted on geographies consisting of 215,332,432 people shows a mild positive correlation between the proportion of Immigrants from Lebanon and unemployment rate among population between the ages 35 and 44 in the United States with a correlation coefficient (R) of 0.377 and weighted average of 5.0%, a difference of 3.0%.
Unemployment Among Ages 35 to 44 years Correlation Summary
| Measurement | Delaware | Immigrants from Lebanon |
| Minimum | 1.6% | 0.50% |
| Maximum | 38.2% | 12.5% |
| Range | 36.6% | 12.0% |
| Mean | 7.1% | 5.0% |
| Median | 5.3% | 4.6% |
| Interquartile 25% (IQ1) | 4.1% | 4.1% |
| Interquartile 75% (IQ3) | 7.7% | 5.4% |
| Interquartile Range (IQR) | 3.7% | 1.3% |
| Standard Deviation (Sample) | 6.9% | 2.6% |
| Standard Deviation (Population) | 6.8% | 2.6% |
Demographics Similar to Delaware and Immigrants from Lebanon by Unemployment Among Ages 35 to 44 years
In terms of unemployment among ages 35 to 44 years, the demographic groups most similar to Delaware are Salvadoran (5.1%, a difference of 0.12%), Immigrants from Honduras (5.1%, a difference of 0.37%), Somali (5.1%, a difference of 0.55%), Nigerian (5.1%, a difference of 0.68%), and Honduran (5.1%, a difference of 0.74%). Similarly, the demographic groups most similar to Immigrants from Lebanon are Panamanian (5.0%, a difference of 0.12%), Potawatomi (5.0%, a difference of 0.12%), Immigrants from Panama (5.0%, a difference of 0.35%), Immigrants from Uzbekistan (5.0%, a difference of 0.59%), and Samoan (5.0%, a difference of 0.74%).
| Demographics | Rating | Rank | Unemployment Among Ages 35 to 44 years |
| Immigrants | Panama | 3.3 /100 | #223 | Tragic 5.0% |
| Panamanians | 2.9 /100 | #224 | Tragic 5.0% |
| Immigrants | Lebanon | 2.7 /100 | #225 | Tragic 5.0% |
| Potawatomi | 2.5 /100 | #226 | Tragic 5.0% |
| Immigrants | Uzbekistan | 1.9 /100 | #227 | Tragic 5.0% |
| Samoans | 1.8 /100 | #228 | Tragic 5.0% |
| Immigrants | Cambodia | 1.5 /100 | #229 | Tragic 5.0% |
| Liberians | 1.3 /100 | #230 | Tragic 5.1% |
| Japanese | 1.2 /100 | #231 | Tragic 5.1% |
| Iroquois | 1.2 /100 | #232 | Tragic 5.1% |
| Immigrants | Nigeria | 1.2 /100 | #233 | Tragic 5.1% |
| Portuguese | 1.1 /100 | #234 | Tragic 5.1% |
| Guamanians/Chamorros | 0.9 /100 | #235 | Tragic 5.1% |
| Central Americans | 0.8 /100 | #236 | Tragic 5.1% |
| Kiowa | 0.8 /100 | #237 | Tragic 5.1% |
| Hondurans | 0.7 /100 | #238 | Tragic 5.1% |
| Nigerians | 0.7 /100 | #239 | Tragic 5.1% |
| Somalis | 0.7 /100 | #240 | Tragic 5.1% |
| Immigrants | Honduras | 0.6 /100 | #241 | Tragic 5.1% |
| Delaware | 0.5 /100 | #242 | Tragic 5.1% |
| Salvadorans | 0.4 /100 | #243 | Tragic 5.1% |