Delaware vs New Zealander Unemployment Among Seniors over 65 years
COMPARE
Delaware
New Zealander
Unemployment Among Seniors over 65 years
Unemployment Among Seniors over 65 years Comparison
Delaware
New Zealanders
5.7%
UNEMPLOYMENT AMONG SENIORS OVER 65 YEARS
0.0/ 100
METRIC RATING
314th/ 347
METRIC RANK
5.1%
UNEMPLOYMENT AMONG SENIORS OVER 65 YEARS
83.2/ 100
METRIC RATING
138th/ 347
METRIC RANK
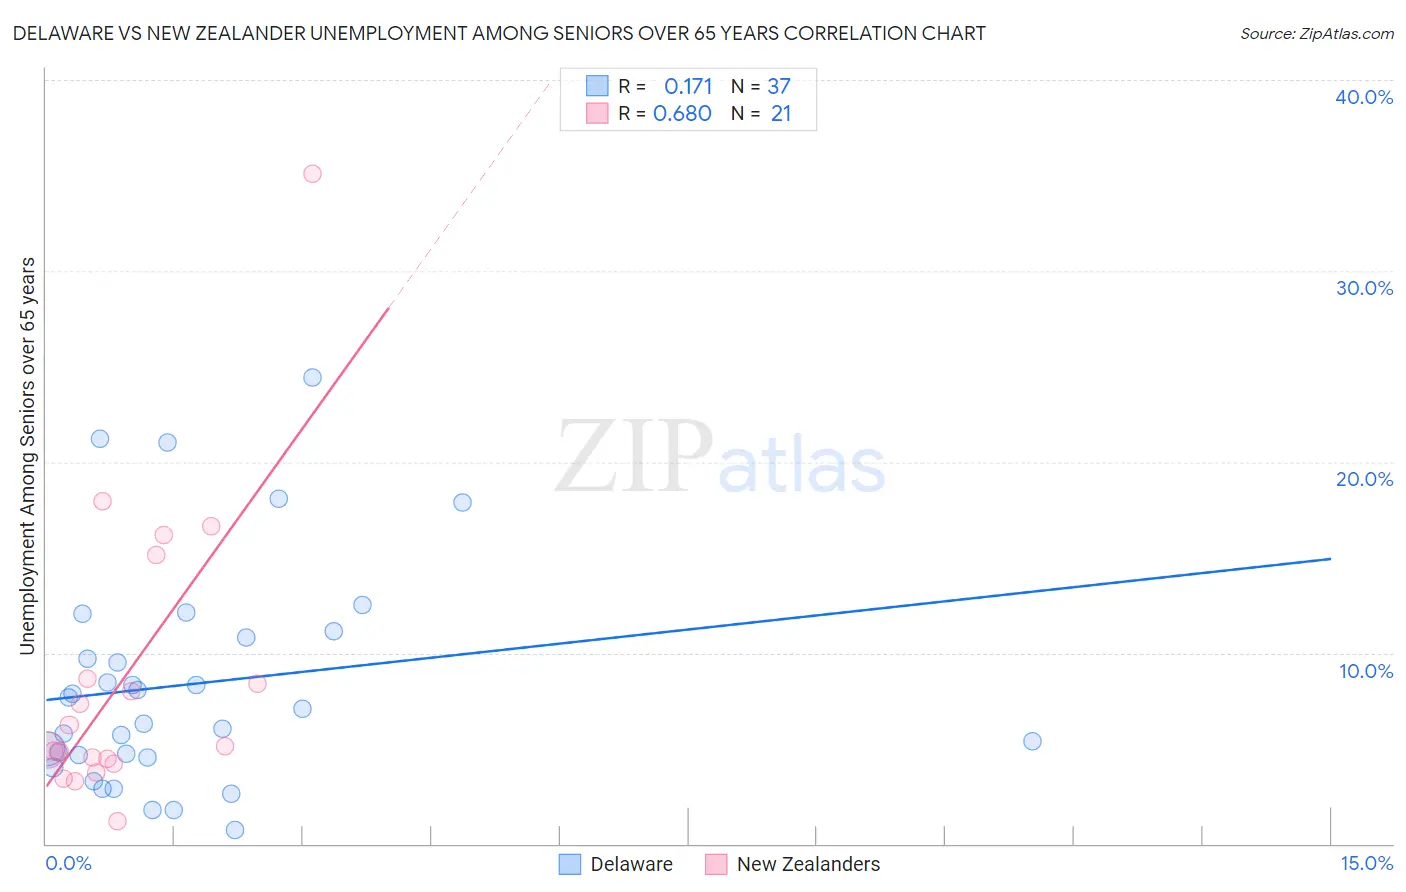
Delaware vs New Zealander Unemployment Among Seniors over 65 years Correlation Chart
The statistical analysis conducted on geographies consisting of 91,321,355 people shows a poor positive correlation between the proportion of Delaware and unemployment rate amomg seniors over the age of 65 in the United States with a correlation coefficient (R) of 0.171 and weighted average of 5.7%. Similarly, the statistical analysis conducted on geographies consisting of 103,565,974 people shows a significant positive correlation between the proportion of New Zealanders and unemployment rate amomg seniors over the age of 65 in the United States with a correlation coefficient (R) of 0.680 and weighted average of 5.1%, a difference of 11.6%.
Unemployment Among Seniors over 65 years Correlation Summary
| Measurement | Delaware | New Zealander |
| Minimum | 0.70% | 1.2% |
| Maximum | 24.4% | 35.1% |
| Range | 23.7% | 33.9% |
| Mean | 8.3% | 8.8% |
| Median | 7.1% | 5.1% |
| Interquartile 25% (IQ1) | 4.6% | 4.3% |
| Interquartile 75% (IQ3) | 11.0% | 11.9% |
| Interquartile Range (IQR) | 6.4% | 7.5% |
| Standard Deviation (Sample) | 5.8% | 7.8% |
| Standard Deviation (Population) | 5.7% | 7.6% |
Similar Demographics by Unemployment Among Seniors over 65 years
Demographics Similar to Delaware by Unemployment Among Seniors over 65 years
In terms of unemployment among seniors over 65 years, the demographic groups most similar to Delaware are Immigrants from El Salvador (5.7%, a difference of 0.030%), Immigrants from Central America (5.7%, a difference of 0.22%), Immigrants from Bahamas (5.7%, a difference of 0.34%), Barbadian (5.6%, a difference of 0.52%), and Immigrants from Ecuador (5.6%, a difference of 0.55%).
| Demographics | Rating | Rank | Unemployment Among Seniors over 65 years |
| Portuguese | 0.0 /100 | #307 | Tragic 5.6% |
| Immigrants | St. Vincent and the Grenadines | 0.0 /100 | #308 | Tragic 5.6% |
| Immigrants | Guatemala | 0.0 /100 | #309 | Tragic 5.6% |
| Salvadorans | 0.0 /100 | #310 | Tragic 5.6% |
| Immigrants | Guyana | 0.0 /100 | #311 | Tragic 5.6% |
| Immigrants | Ecuador | 0.0 /100 | #312 | Tragic 5.6% |
| Barbadians | 0.0 /100 | #313 | Tragic 5.6% |
| Delaware | 0.0 /100 | #314 | Tragic 5.7% |
| Immigrants | El Salvador | 0.0 /100 | #315 | Tragic 5.7% |
| Immigrants | Central America | 0.0 /100 | #316 | Tragic 5.7% |
| Immigrants | Bahamas | 0.0 /100 | #317 | Tragic 5.7% |
| Vietnamese | 0.0 /100 | #318 | Tragic 5.7% |
| Immigrants | Bangladesh | 0.0 /100 | #319 | Tragic 5.7% |
| Immigrants | Mexico | 0.0 /100 | #320 | Tragic 5.7% |
| British West Indians | 0.0 /100 | #321 | Tragic 5.8% |
Demographics Similar to New Zealanders by Unemployment Among Seniors over 65 years
In terms of unemployment among seniors over 65 years, the demographic groups most similar to New Zealanders are Immigrants from Panama (5.1%, a difference of 0.010%), Immigrants from Chile (5.1%, a difference of 0.020%), Arab (5.1%, a difference of 0.060%), Ukrainian (5.1%, a difference of 0.070%), and White/Caucasian (5.1%, a difference of 0.070%).
| Demographics | Rating | Rank | Unemployment Among Seniors over 65 years |
| Immigrants | Australia | 85.8 /100 | #131 | Excellent 5.1% |
| Chileans | 85.6 /100 | #132 | Excellent 5.1% |
| Syrians | 85.3 /100 | #133 | Excellent 5.1% |
| Turks | 84.9 /100 | #134 | Excellent 5.1% |
| Ukrainians | 84.4 /100 | #135 | Excellent 5.1% |
| Whites/Caucasians | 84.4 /100 | #136 | Excellent 5.1% |
| Arabs | 84.3 /100 | #137 | Excellent 5.1% |
| New Zealanders | 83.2 /100 | #138 | Excellent 5.1% |
| Immigrants | Panama | 83.0 /100 | #139 | Excellent 5.1% |
| Immigrants | Chile | 83.0 /100 | #140 | Excellent 5.1% |
| Cherokee | 81.6 /100 | #141 | Excellent 5.1% |
| Immigrants | Indonesia | 81.0 /100 | #142 | Excellent 5.1% |
| Senegalese | 80.4 /100 | #143 | Excellent 5.1% |
| Poles | 80.3 /100 | #144 | Excellent 5.1% |
| Spanish | 78.8 /100 | #145 | Good 5.1% |