Sierra Leonean vs Immigrants from Belarus Unemployment Among Ages 60 to 64 years
COMPARE
Sierra Leonean
Immigrants from Belarus
Unemployment Among Ages 60 to 64 years
Unemployment Among Ages 60 to 64 years Comparison
Sierra Leoneans
Immigrants from Belarus
4.9%
UNEMPLOYMENT AMONG AGES 60 TO 64 YEARS
16.5/ 100
METRIC RATING
209th/ 347
METRIC RANK
5.0%
UNEMPLOYMENT AMONG AGES 60 TO 64 YEARS
6.4/ 100
METRIC RATING
228th/ 347
METRIC RANK
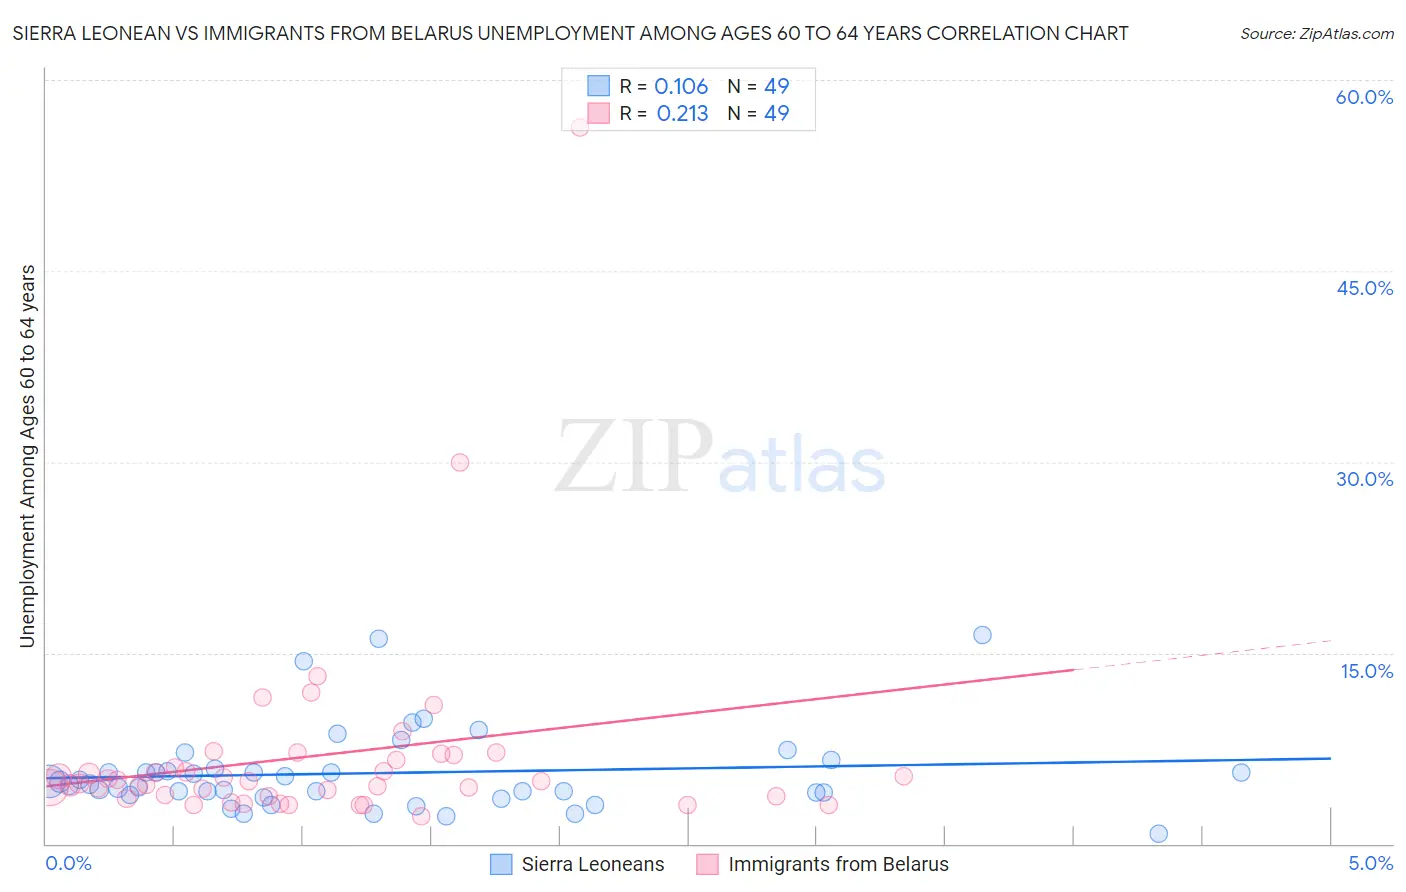
Sierra Leonean vs Immigrants from Belarus Unemployment Among Ages 60 to 64 years Correlation Chart
The statistical analysis conducted on geographies consisting of 81,145,085 people shows a poor positive correlation between the proportion of Sierra Leoneans and unemployment rate among population between the ages 60 and 64 in the United States with a correlation coefficient (R) of 0.106 and weighted average of 4.9%. Similarly, the statistical analysis conducted on geographies consisting of 144,606,203 people shows a weak positive correlation between the proportion of Immigrants from Belarus and unemployment rate among population between the ages 60 and 64 in the United States with a correlation coefficient (R) of 0.213 and weighted average of 5.0%, a difference of 0.93%.
Unemployment Among Ages 60 to 64 years Correlation Summary
| Measurement | Sierra Leonean | Immigrants from Belarus |
| Minimum | 0.80% | 2.2% |
| Maximum | 16.4% | 56.3% |
| Range | 15.6% | 54.1% |
| Mean | 5.5% | 6.9% |
| Median | 4.7% | 4.9% |
| Interquartile 25% (IQ1) | 3.9% | 3.7% |
| Interquartile 75% (IQ3) | 5.8% | 6.8% |
| Interquartile Range (IQR) | 1.9% | 3.0% |
| Standard Deviation (Sample) | 3.2% | 8.4% |
| Standard Deviation (Population) | 3.2% | 8.3% |
Demographics Similar to Sierra Leoneans and Immigrants from Belarus by Unemployment Among Ages 60 to 64 years
In terms of unemployment among ages 60 to 64 years, the demographic groups most similar to Sierra Leoneans are German Russian (4.9%, a difference of 0.010%), Cherokee (4.9%, a difference of 0.030%), Blackfeet (4.9%, a difference of 0.050%), Moroccan (4.9%, a difference of 0.10%), and Eastern European (4.9%, a difference of 0.15%). Similarly, the demographic groups most similar to Immigrants from Belarus are Nigerian (5.0%, a difference of 0.050%), Immigrants from Chile (5.0%, a difference of 0.060%), Immigrants from Ireland (5.0%, a difference of 0.11%), Immigrants from Cameroon (5.0%, a difference of 0.27%), and Crow (5.0%, a difference of 0.39%).
| Demographics | Rating | Rank | Unemployment Among Ages 60 to 64 years |
| German Russians | 16.8 /100 | #208 | Poor 4.9% |
| Sierra Leoneans | 16.5 /100 | #209 | Poor 4.9% |
| Cherokee | 16.1 /100 | #210 | Poor 4.9% |
| Blackfeet | 15.7 /100 | #211 | Poor 4.9% |
| Moroccans | 15.0 /100 | #212 | Poor 4.9% |
| Eastern Europeans | 14.3 /100 | #213 | Poor 4.9% |
| Immigrants | Russia | 13.7 /100 | #214 | Poor 4.9% |
| Immigrants | South Eastern Asia | 13.1 /100 | #215 | Poor 4.9% |
| Cajuns | 12.3 /100 | #216 | Poor 4.9% |
| Koreans | 12.2 /100 | #217 | Poor 4.9% |
| Immigrants | Singapore | 12.0 /100 | #218 | Poor 4.9% |
| Immigrants | Brazil | 11.7 /100 | #219 | Poor 4.9% |
| Ottawa | 11.6 /100 | #220 | Poor 4.9% |
| Ugandans | 10.5 /100 | #221 | Poor 4.9% |
| Brazilians | 10.1 /100 | #222 | Poor 5.0% |
| Crow | 9.7 /100 | #223 | Tragic 5.0% |
| Immigrants | Cameroon | 8.5 /100 | #224 | Tragic 5.0% |
| Immigrants | Ireland | 7.2 /100 | #225 | Tragic 5.0% |
| Immigrants | Chile | 6.8 /100 | #226 | Tragic 5.0% |
| Nigerians | 6.8 /100 | #227 | Tragic 5.0% |
| Immigrants | Belarus | 6.4 /100 | #228 | Tragic 5.0% |