Czech vs Navajo Unemployment Among Ages 60 to 64 years
COMPARE
Czech
Navajo
Unemployment Among Ages 60 to 64 years
Unemployment Among Ages 60 to 64 years Comparison
Czechs
Navajo
4.4%
UNEMPLOYMENT AMONG AGES 60 TO 64 YEARS
100.0/ 100
METRIC RATING
26th/ 347
METRIC RANK
6.3%
UNEMPLOYMENT AMONG AGES 60 TO 64 YEARS
0.0/ 100
METRIC RATING
337th/ 347
METRIC RANK
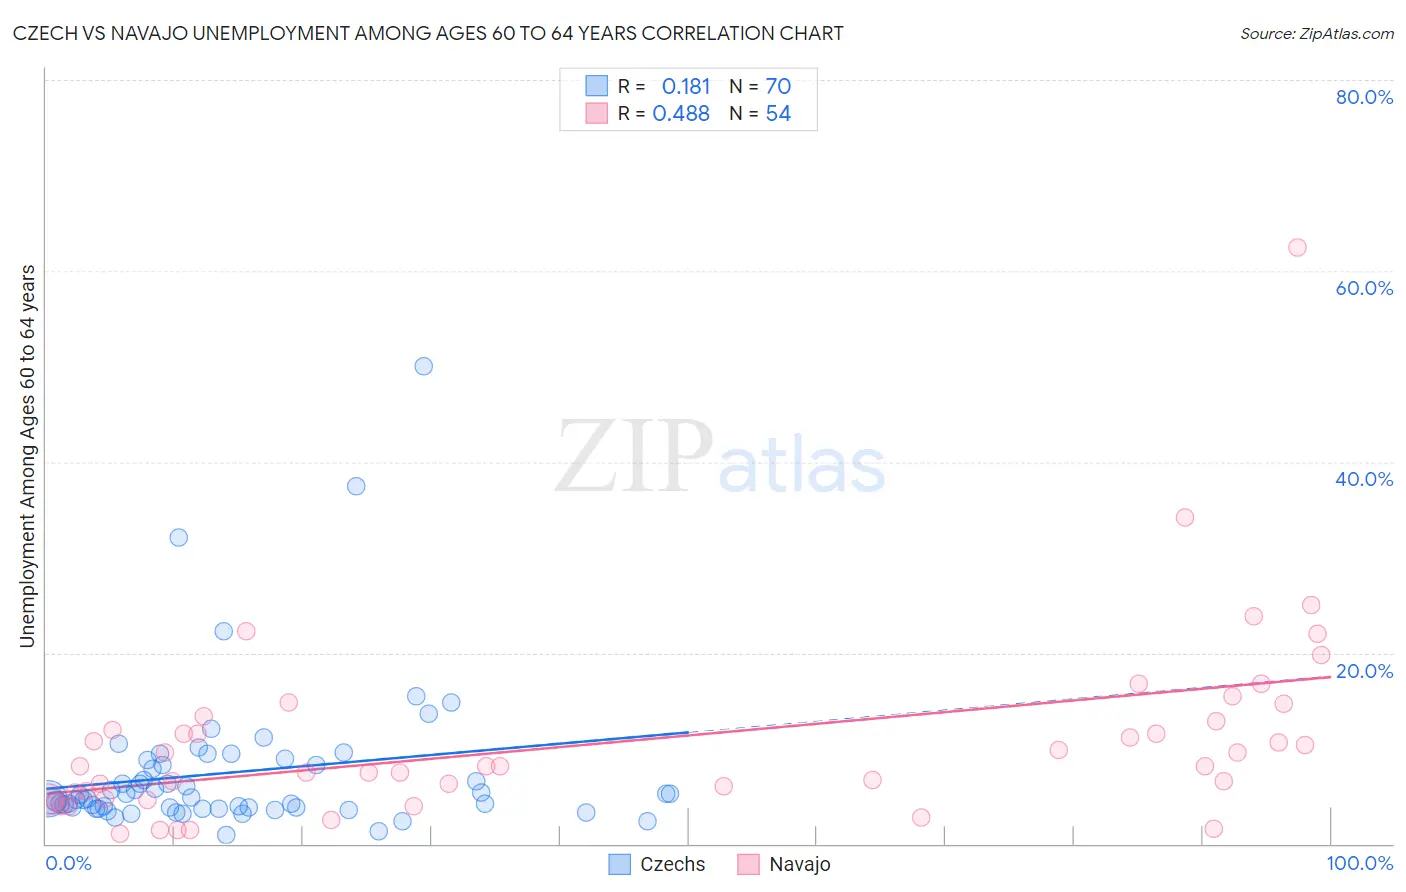
Czech vs Navajo Unemployment Among Ages 60 to 64 years Correlation Chart
The statistical analysis conducted on geographies consisting of 416,417,760 people shows a poor positive correlation between the proportion of Czechs and unemployment rate among population between the ages 60 and 64 in the United States with a correlation coefficient (R) of 0.181 and weighted average of 4.4%. Similarly, the statistical analysis conducted on geographies consisting of 208,494,883 people shows a moderate positive correlation between the proportion of Navajo and unemployment rate among population between the ages 60 and 64 in the United States with a correlation coefficient (R) of 0.488 and weighted average of 6.3%, a difference of 40.8%.
Unemployment Among Ages 60 to 64 years Correlation Summary
| Measurement | Czech | Navajo |
| Minimum | 0.87% | 1.0% |
| Maximum | 50.0% | 62.5% |
| Range | 49.1% | 61.5% |
| Mean | 7.5% | 10.7% |
| Median | 4.8% | 8.1% |
| Interquartile 25% (IQ1) | 3.7% | 4.8% |
| Interquartile 75% (IQ3) | 8.3% | 12.8% |
| Interquartile Range (IQR) | 4.6% | 8.0% |
| Standard Deviation (Sample) | 7.9% | 9.9% |
| Standard Deviation (Population) | 7.9% | 9.8% |
Similar Demographics by Unemployment Among Ages 60 to 64 years
Demographics Similar to Czechs by Unemployment Among Ages 60 to 64 years
In terms of unemployment among ages 60 to 64 years, the demographic groups most similar to Czechs are Immigrants from Iraq (4.5%, a difference of 0.080%), Yugoslavian (4.4%, a difference of 0.10%), Immigrants from Nepal (4.5%, a difference of 0.16%), Cuban (4.5%, a difference of 0.39%), and Immigrants from Venezuela (4.5%, a difference of 0.41%).
| Demographics | Rating | Rank | Unemployment Among Ages 60 to 64 years |
| Tsimshian | 100.0 /100 | #19 | Exceptional 4.4% |
| Afghans | 100.0 /100 | #20 | Exceptional 4.4% |
| Immigrants | Cabo Verde | 100.0 /100 | #21 | Exceptional 4.4% |
| Cape Verdeans | 100.0 /100 | #22 | Exceptional 4.4% |
| Immigrants | Zaire | 100.0 /100 | #23 | Exceptional 4.4% |
| Immigrants | Burma/Myanmar | 100.0 /100 | #24 | Exceptional 4.4% |
| Yugoslavians | 100.0 /100 | #25 | Exceptional 4.4% |
| Czechs | 100.0 /100 | #26 | Exceptional 4.4% |
| Immigrants | Iraq | 100.0 /100 | #27 | Exceptional 4.5% |
| Immigrants | Nepal | 100.0 /100 | #28 | Exceptional 4.5% |
| Cubans | 100.0 /100 | #29 | Exceptional 4.5% |
| Immigrants | Venezuela | 100.0 /100 | #30 | Exceptional 4.5% |
| Immigrants | Eritrea | 100.0 /100 | #31 | Exceptional 4.5% |
| Zimbabweans | 100.0 /100 | #32 | Exceptional 4.5% |
| Carpatho Rusyns | 100.0 /100 | #33 | Exceptional 4.5% |
Demographics Similar to Navajo by Unemployment Among Ages 60 to 64 years
In terms of unemployment among ages 60 to 64 years, the demographic groups most similar to Navajo are Arapaho (6.3%, a difference of 0.48%), Kiowa (6.2%, a difference of 1.1%), Tlingit-Haida (6.4%, a difference of 1.9%), Vietnamese (6.1%, a difference of 3.0%), and Puerto Rican (6.1%, a difference of 3.3%).
| Demographics | Rating | Rank | Unemployment Among Ages 60 to 64 years |
| Immigrants | Armenia | 0.0 /100 | #330 | Tragic 6.0% |
| Yakama | 0.0 /100 | #331 | Tragic 6.0% |
| Dominicans | 0.0 /100 | #332 | Tragic 6.0% |
| Immigrants | Dominican Republic | 0.0 /100 | #333 | Tragic 6.0% |
| Puerto Ricans | 0.0 /100 | #334 | Tragic 6.1% |
| Vietnamese | 0.0 /100 | #335 | Tragic 6.1% |
| Kiowa | 0.0 /100 | #336 | Tragic 6.2% |
| Navajo | 0.0 /100 | #337 | Tragic 6.3% |
| Arapaho | 0.0 /100 | #338 | Tragic 6.3% |
| Tlingit-Haida | 0.0 /100 | #339 | Tragic 6.4% |
| Pueblo | 0.0 /100 | #340 | Tragic 6.7% |
| Yuman | 0.0 /100 | #341 | Tragic 6.8% |
| Aleuts | 0.0 /100 | #342 | Tragic 6.8% |
| Immigrants | Yemen | 0.0 /100 | #343 | Tragic 6.8% |
| Alaska Natives | 0.0 /100 | #344 | Tragic 7.6% |