Immigrants from Latvia vs Syrian Unemployment Among Ages 55 to 59 years
COMPARE
Immigrants from Latvia
Syrian
Unemployment Among Ages 55 to 59 years
Unemployment Among Ages 55 to 59 years Comparison
Immigrants from Latvia
Syrians
4.9%
UNEMPLOYMENT AMONG AGES 55 TO 59 YEARS
18.5/ 100
METRIC RATING
204th/ 347
METRIC RANK
4.9%
UNEMPLOYMENT AMONG AGES 55 TO 59 YEARS
8.6/ 100
METRIC RATING
215th/ 347
METRIC RANK
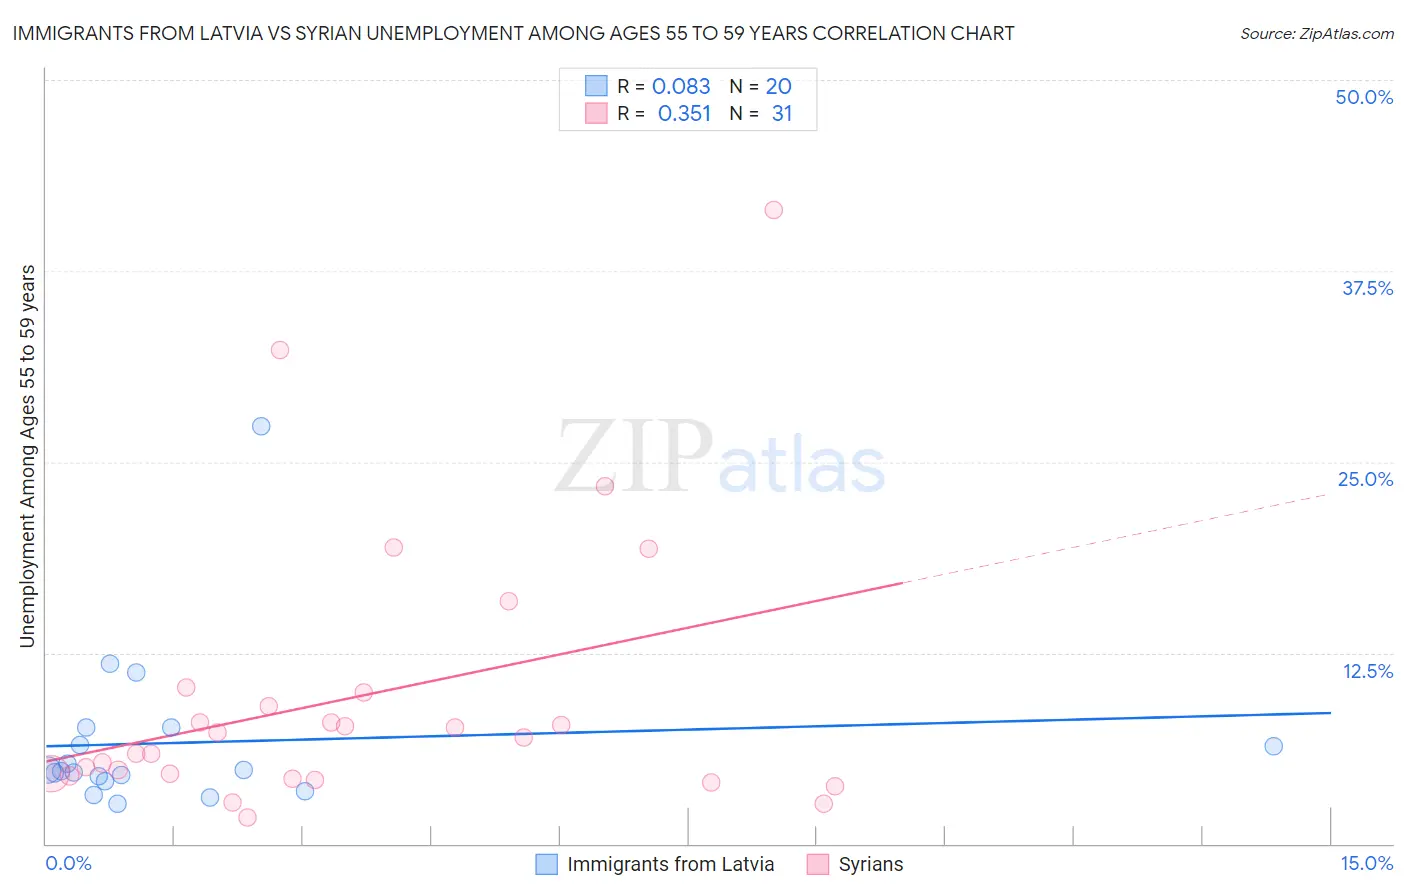
Immigrants from Latvia vs Syrian Unemployment Among Ages 55 to 59 years Correlation Chart
The statistical analysis conducted on geographies consisting of 111,271,866 people shows a slight positive correlation between the proportion of Immigrants from Latvia and unemployment rate among population between the ages 55 and 59 in the United States with a correlation coefficient (R) of 0.083 and weighted average of 4.9%. Similarly, the statistical analysis conducted on geographies consisting of 254,024,924 people shows a mild positive correlation between the proportion of Syrians and unemployment rate among population between the ages 55 and 59 in the United States with a correlation coefficient (R) of 0.351 and weighted average of 4.9%, a difference of 0.88%.
Unemployment Among Ages 55 to 59 years Correlation Summary
| Measurement | Immigrants from Latvia | Syrian |
| Minimum | 2.6% | 1.7% |
| Maximum | 27.3% | 41.5% |
| Range | 24.7% | 39.8% |
| Mean | 6.6% | 9.6% |
| Median | 4.8% | 7.0% |
| Interquartile 25% (IQ1) | 4.2% | 4.4% |
| Interquartile 75% (IQ3) | 7.0% | 9.9% |
| Interquartile Range (IQR) | 2.8% | 5.5% |
| Standard Deviation (Sample) | 5.5% | 9.0% |
| Standard Deviation (Population) | 5.3% | 8.9% |
Demographics Similar to Immigrants from Latvia and Syrians by Unemployment Among Ages 55 to 59 years
In terms of unemployment among ages 55 to 59 years, the demographic groups most similar to Immigrants from Latvia are Haitian (4.9%, a difference of 0.020%), Guamanian/Chamorro (4.9%, a difference of 0.15%), Lumbee (4.9%, a difference of 0.25%), Immigrants from South America (4.9%, a difference of 0.28%), and Basque (4.9%, a difference of 0.30%). Similarly, the demographic groups most similar to Syrians are Spanish American (4.9%, a difference of 0.060%), Immigrants from Brazil (4.9%, a difference of 0.070%), Immigrants from Austria (4.9%, a difference of 0.080%), Immigrants from Nigeria (4.9%, a difference of 0.080%), and Immigrants from Denmark (4.9%, a difference of 0.20%).
| Demographics | Rating | Rank | Unemployment Among Ages 55 to 59 years |
| Immigrants | Russia | 23.7 /100 | #199 | Fair 4.9% |
| Basques | 23.3 /100 | #200 | Fair 4.9% |
| Immigrants | South America | 23.1 /100 | #201 | Fair 4.9% |
| Lumbee | 22.5 /100 | #202 | Fair 4.9% |
| Guamanians/Chamorros | 20.8 /100 | #203 | Fair 4.9% |
| Immigrants | Latvia | 18.5 /100 | #204 | Poor 4.9% |
| Haitians | 18.1 /100 | #205 | Poor 4.9% |
| Immigrants | Belarus | 14.1 /100 | #206 | Poor 4.9% |
| Immigrants | Australia | 14.1 /100 | #207 | Poor 4.9% |
| Immigrants | Kazakhstan | 14.0 /100 | #208 | Poor 4.9% |
| Immigrants | Haiti | 13.3 /100 | #209 | Poor 4.9% |
| Creek | 12.9 /100 | #210 | Poor 4.9% |
| Hawaiians | 12.8 /100 | #211 | Poor 4.9% |
| Immigrants | Nonimmigrants | 11.2 /100 | #212 | Poor 4.9% |
| Bermudans | 11.0 /100 | #213 | Poor 4.9% |
| Immigrants | Denmark | 10.3 /100 | #214 | Poor 4.9% |
| Syrians | 8.6 /100 | #215 | Tragic 4.9% |
| Spanish Americans | 8.1 /100 | #216 | Tragic 4.9% |
| Immigrants | Brazil | 8.1 /100 | #217 | Tragic 4.9% |
| Immigrants | Austria | 8.0 /100 | #218 | Tragic 4.9% |
| Immigrants | Nigeria | 8.0 /100 | #219 | Tragic 4.9% |