Cypriot vs Northern European Unemployment Among Ages 55 to 59 years
COMPARE
Cypriot
Northern European
Unemployment Among Ages 55 to 59 years
Unemployment Among Ages 55 to 59 years Comparison
Cypriots
Northern Europeans
4.5%
UNEMPLOYMENT AMONG AGES 55 TO 59 YEARS
99.9/ 100
METRIC RATING
35th/ 347
METRIC RANK
4.5%
UNEMPLOYMENT AMONG AGES 55 TO 59 YEARS
99.6/ 100
METRIC RATING
57th/ 347
METRIC RANK
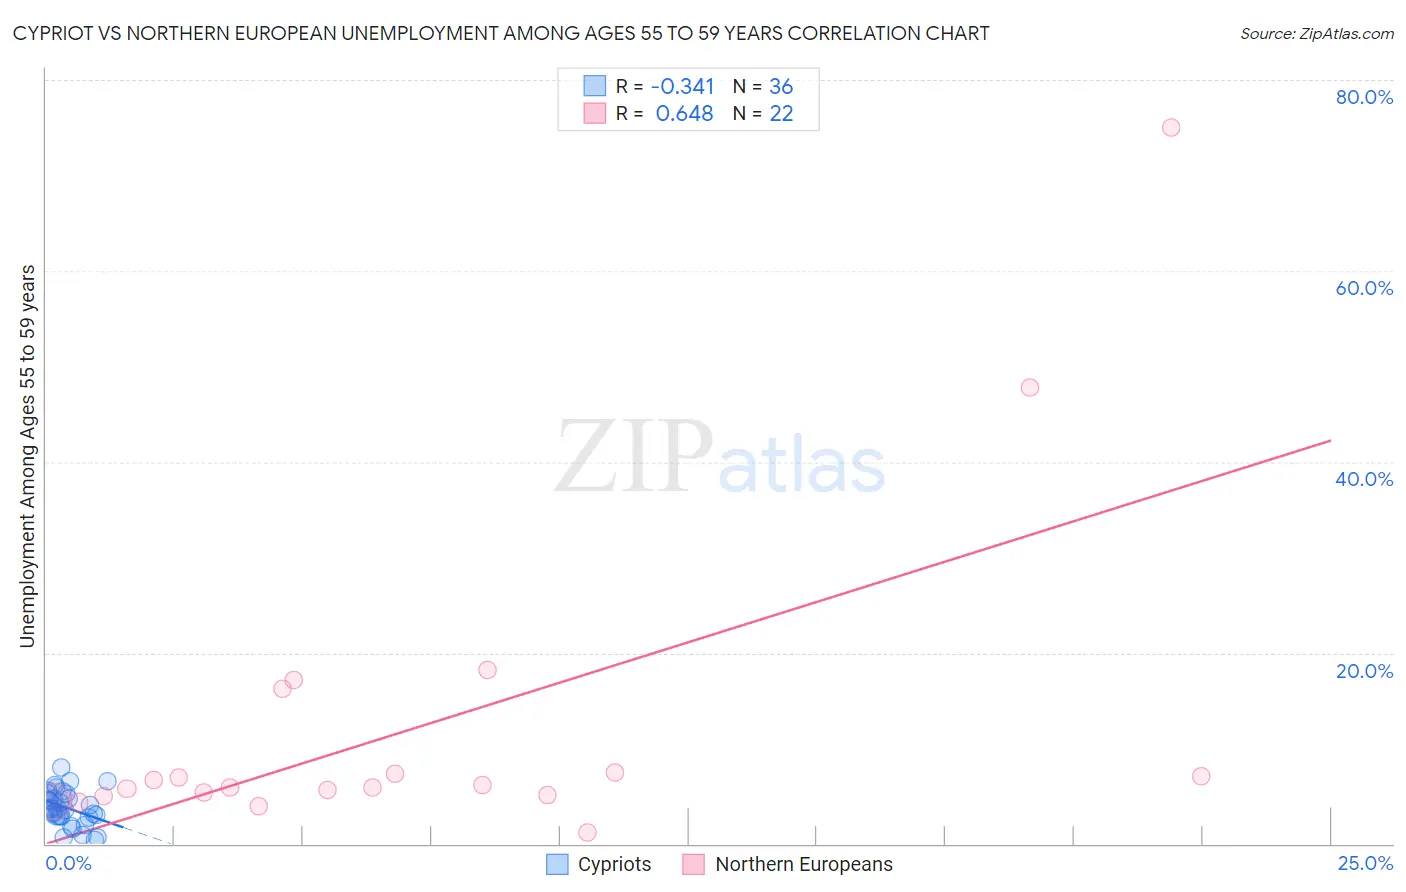
Cypriot vs Northern European Unemployment Among Ages 55 to 59 years Correlation Chart
The statistical analysis conducted on geographies consisting of 60,659,935 people shows a mild negative correlation between the proportion of Cypriots and unemployment rate among population between the ages 55 and 59 in the United States with a correlation coefficient (R) of -0.341 and weighted average of 4.5%. Similarly, the statistical analysis conducted on geographies consisting of 371,257,801 people shows a significant positive correlation between the proportion of Northern Europeans and unemployment rate among population between the ages 55 and 59 in the United States with a correlation coefficient (R) of 0.648 and weighted average of 4.5%, a difference of 1.6%.
Unemployment Among Ages 55 to 59 years Correlation Summary
| Measurement | Cypriot | Northern European |
| Minimum | 0.40% | 1.2% |
| Maximum | 8.0% | 75.0% |
| Range | 7.6% | 73.8% |
| Mean | 3.8% | 12.2% |
| Median | 3.6% | 6.0% |
| Interquartile 25% (IQ1) | 2.8% | 5.2% |
| Interquartile 75% (IQ3) | 5.0% | 7.4% |
| Interquartile Range (IQR) | 2.1% | 2.2% |
| Standard Deviation (Sample) | 1.8% | 17.0% |
| Standard Deviation (Population) | 1.8% | 16.6% |
Similar Demographics by Unemployment Among Ages 55 to 59 years
Demographics Similar to Cypriots by Unemployment Among Ages 55 to 59 years
In terms of unemployment among ages 55 to 59 years, the demographic groups most similar to Cypriots are Thai (4.5%, a difference of 0.010%), Belgian (4.5%, a difference of 0.090%), Ethiopian (4.5%, a difference of 0.090%), Immigrants from Bulgaria (4.5%, a difference of 0.090%), and Immigrants from Ethiopia (4.5%, a difference of 0.21%).
| Demographics | Rating | Rank | Unemployment Among Ages 55 to 59 years |
| Immigrants | Eastern Africa | 99.9 /100 | #28 | Exceptional 4.5% |
| Palestinians | 99.9 /100 | #29 | Exceptional 4.5% |
| Immigrants | Kenya | 99.9 /100 | #30 | Exceptional 4.5% |
| Germans | 99.9 /100 | #31 | Exceptional 4.5% |
| Immigrants | Ethiopia | 99.9 /100 | #32 | Exceptional 4.5% |
| Belgians | 99.9 /100 | #33 | Exceptional 4.5% |
| Thais | 99.9 /100 | #34 | Exceptional 4.5% |
| Cypriots | 99.9 /100 | #35 | Exceptional 4.5% |
| Ethiopians | 99.9 /100 | #36 | Exceptional 4.5% |
| Immigrants | Bulgaria | 99.9 /100 | #37 | Exceptional 4.5% |
| Assyrians/Chaldeans/Syriacs | 99.9 /100 | #38 | Exceptional 4.5% |
| English | 99.9 /100 | #39 | Exceptional 4.5% |
| Swiss | 99.8 /100 | #40 | Exceptional 4.5% |
| Luxembourgers | 99.8 /100 | #41 | Exceptional 4.5% |
| Immigrants | Kuwait | 99.8 /100 | #42 | Exceptional 4.5% |
Demographics Similar to Northern Europeans by Unemployment Among Ages 55 to 59 years
In terms of unemployment among ages 55 to 59 years, the demographic groups most similar to Northern Europeans are Welsh (4.5%, a difference of 0.010%), Okinawan (4.5%, a difference of 0.020%), Immigrants from Nepal (4.5%, a difference of 0.060%), Scottish (4.5%, a difference of 0.16%), and Immigrants from Middle Africa (4.5%, a difference of 0.16%).
| Demographics | Rating | Rank | Unemployment Among Ages 55 to 59 years |
| Immigrants | Pakistan | 99.7 /100 | #50 | Exceptional 4.5% |
| Maltese | 99.7 /100 | #51 | Exceptional 4.5% |
| Scottish | 99.7 /100 | #52 | Exceptional 4.5% |
| Immigrants | Middle Africa | 99.7 /100 | #53 | Exceptional 4.5% |
| Burmese | 99.7 /100 | #54 | Exceptional 4.5% |
| Immigrants | Nepal | 99.6 /100 | #55 | Exceptional 4.5% |
| Welsh | 99.6 /100 | #56 | Exceptional 4.5% |
| Northern Europeans | 99.6 /100 | #57 | Exceptional 4.5% |
| Okinawans | 99.6 /100 | #58 | Exceptional 4.5% |
| Immigrants | Uganda | 99.5 /100 | #59 | Exceptional 4.6% |
| Dutch | 99.5 /100 | #60 | Exceptional 4.6% |
| Immigrants | Argentina | 99.5 /100 | #61 | Exceptional 4.6% |
| Slovenes | 99.3 /100 | #62 | Exceptional 4.6% |
| Immigrants | South Central Asia | 99.3 /100 | #63 | Exceptional 4.6% |
| Argentineans | 99.1 /100 | #64 | Exceptional 4.6% |