Cypriot vs Immigrants from St. Vincent and the Grenadines Unemployment Among Women with Children Under 6 years
COMPARE
Cypriot
Immigrants from St. Vincent and the Grenadines
Unemployment Among Women with Children Under 6 years
Unemployment Among Women with Children Under 6 years Comparison
Cypriots
Immigrants from St. Vincent and the Grenadines
6.5%
UNEMPLOYMENT AMONG WOMEN WITH CHILDREN UNDER 6 YEARS
100.0/ 100
METRIC RATING
26th/ 347
METRIC RANK
7.7%
UNEMPLOYMENT AMONG WOMEN WITH CHILDREN UNDER 6 YEARS
31.1/ 100
METRIC RATING
196th/ 347
METRIC RANK
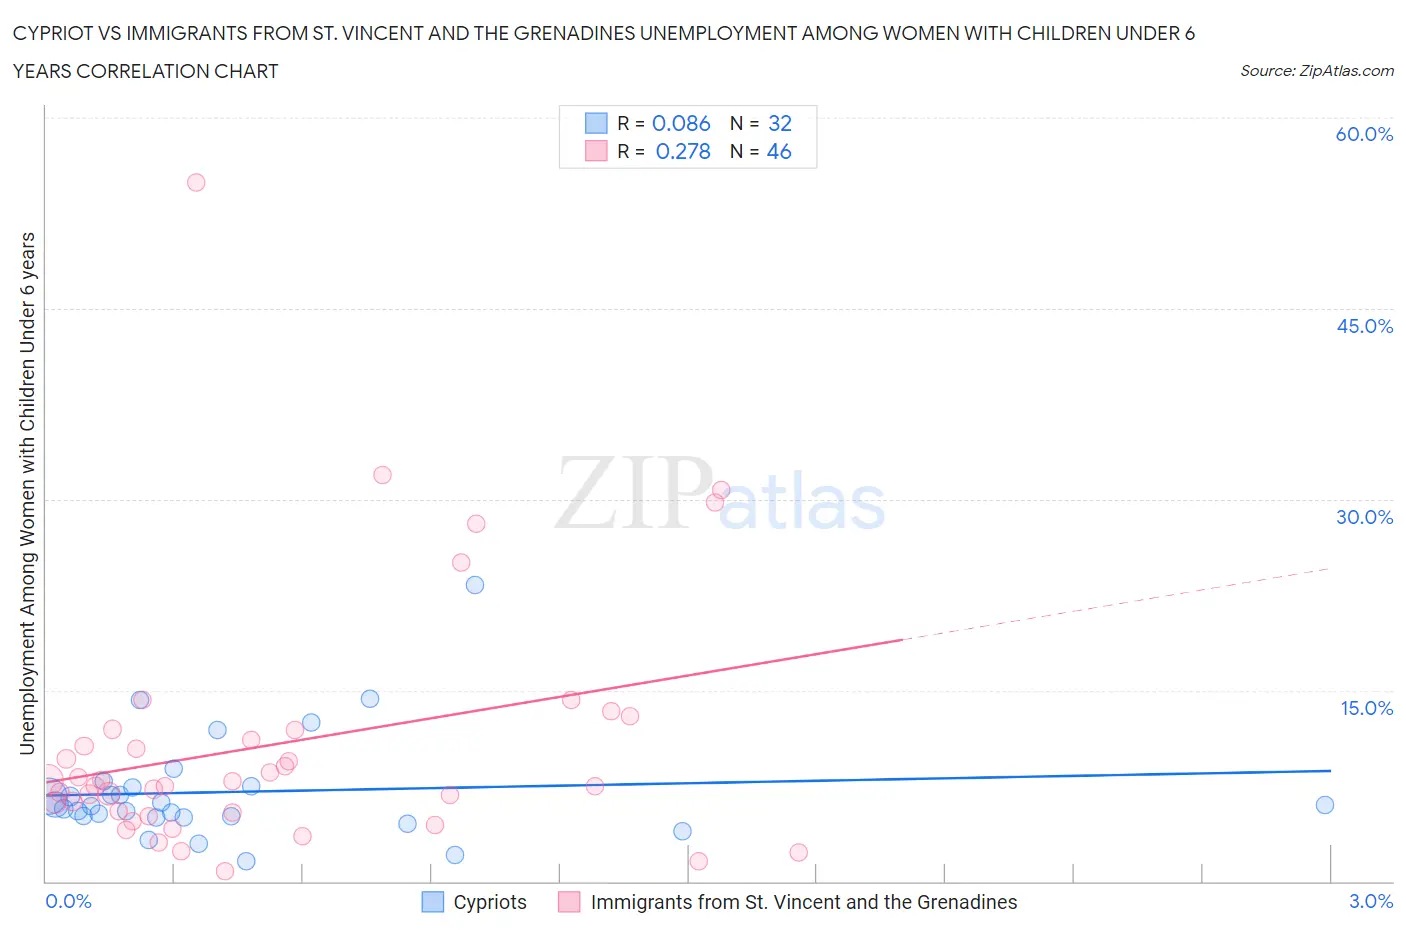
Cypriot vs Immigrants from St. Vincent and the Grenadines Unemployment Among Women with Children Under 6 years Correlation Chart
The statistical analysis conducted on geographies consisting of 55,986,412 people shows a slight positive correlation between the proportion of Cypriots and unemployment rate among women with children under the age of 6 in the United States with a correlation coefficient (R) of 0.086 and weighted average of 6.5%. Similarly, the statistical analysis conducted on geographies consisting of 51,811,256 people shows a weak positive correlation between the proportion of Immigrants from St. Vincent and the Grenadines and unemployment rate among women with children under the age of 6 in the United States with a correlation coefficient (R) of 0.278 and weighted average of 7.7%, a difference of 18.5%.
Unemployment Among Women with Children Under 6 years Correlation Summary
| Measurement | Cypriot | Immigrants from St. Vincent and the Grenadines |
| Minimum | 1.6% | 0.80% |
| Maximum | 23.3% | 54.9% |
| Range | 21.7% | 54.1% |
| Mean | 7.0% | 10.8% |
| Median | 5.9% | 7.7% |
| Interquartile 25% (IQ1) | 5.1% | 5.4% |
| Interquartile 75% (IQ3) | 7.4% | 11.9% |
| Interquartile Range (IQR) | 2.4% | 6.5% |
| Standard Deviation (Sample) | 4.3% | 10.1% |
| Standard Deviation (Population) | 4.2% | 10.0% |
Similar Demographics by Unemployment Among Women with Children Under 6 years
Demographics Similar to Cypriots by Unemployment Among Women with Children Under 6 years
In terms of unemployment among women with children under 6 years, the demographic groups most similar to Cypriots are Soviet Union (6.5%, a difference of 0.080%), Laotian (6.5%, a difference of 0.10%), Immigrants from Japan (6.5%, a difference of 0.10%), Immigrants from Israel (6.5%, a difference of 0.12%), and Bulgarian (6.5%, a difference of 0.25%).
| Demographics | Rating | Rank | Unemployment Among Women with Children Under 6 years |
| Mongolians | 100.0 /100 | #19 | Exceptional 6.5% |
| Ute | 100.0 /100 | #20 | Exceptional 6.5% |
| Burmese | 100.0 /100 | #21 | Exceptional 6.5% |
| Immigrants | Korea | 100.0 /100 | #22 | Exceptional 6.5% |
| Bulgarians | 100.0 /100 | #23 | Exceptional 6.5% |
| Laotians | 100.0 /100 | #24 | Exceptional 6.5% |
| Soviet Union | 100.0 /100 | #25 | Exceptional 6.5% |
| Cypriots | 100.0 /100 | #26 | Exceptional 6.5% |
| Immigrants | Japan | 100.0 /100 | #27 | Exceptional 6.5% |
| Immigrants | Israel | 100.0 /100 | #28 | Exceptional 6.5% |
| Immigrants | Sweden | 100.0 /100 | #29 | Exceptional 6.6% |
| Immigrants | Belarus | 100.0 /100 | #30 | Exceptional 6.6% |
| Immigrants | Moldova | 100.0 /100 | #31 | Exceptional 6.6% |
| Tsimshian | 100.0 /100 | #32 | Exceptional 6.6% |
| Immigrants | Vietnam | 100.0 /100 | #33 | Exceptional 6.6% |
Demographics Similar to Immigrants from St. Vincent and the Grenadines by Unemployment Among Women with Children Under 6 years
In terms of unemployment among women with children under 6 years, the demographic groups most similar to Immigrants from St. Vincent and the Grenadines are Malaysian (7.7%, a difference of 0.0%), Italian (7.7%, a difference of 0.050%), Syrian (7.7%, a difference of 0.060%), Lithuanian (7.8%, a difference of 0.080%), and Immigrants from Austria (7.7%, a difference of 0.10%).
| Demographics | Rating | Rank | Unemployment Among Women with Children Under 6 years |
| Immigrants | Panama | 35.7 /100 | #189 | Fair 7.7% |
| Immigrants | North Macedonia | 34.4 /100 | #190 | Fair 7.7% |
| Immigrants | Austria | 32.4 /100 | #191 | Fair 7.7% |
| Immigrants | Africa | 32.4 /100 | #192 | Fair 7.7% |
| Slavs | 32.4 /100 | #193 | Fair 7.7% |
| Syrians | 31.9 /100 | #194 | Fair 7.7% |
| Malaysians | 31.1 /100 | #195 | Fair 7.7% |
| Immigrants | St. Vincent and the Grenadines | 31.1 /100 | #196 | Fair 7.7% |
| Italians | 30.4 /100 | #197 | Fair 7.7% |
| Lithuanians | 30.0 /100 | #198 | Fair 7.8% |
| Immigrants | Poland | 27.3 /100 | #199 | Fair 7.8% |
| Guamanians/Chamorros | 25.5 /100 | #200 | Fair 7.8% |
| Basques | 24.7 /100 | #201 | Fair 7.8% |
| Sudanese | 23.5 /100 | #202 | Fair 7.8% |
| Spaniards | 23.3 /100 | #203 | Fair 7.8% |