Cuban vs Yaqui Single Mother Households
COMPARE
Cuban
Yaqui
Single Mother Households
Single Mother Households Comparison
Cubans
Yaqui
7.2%
SINGLE MOTHER HOUSEHOLDS
0.6/ 100
METRIC RATING
244th/ 347
METRIC RANK
7.4%
SINGLE MOTHER HOUSEHOLDS
0.1/ 100
METRIC RATING
264th/ 347
METRIC RANK
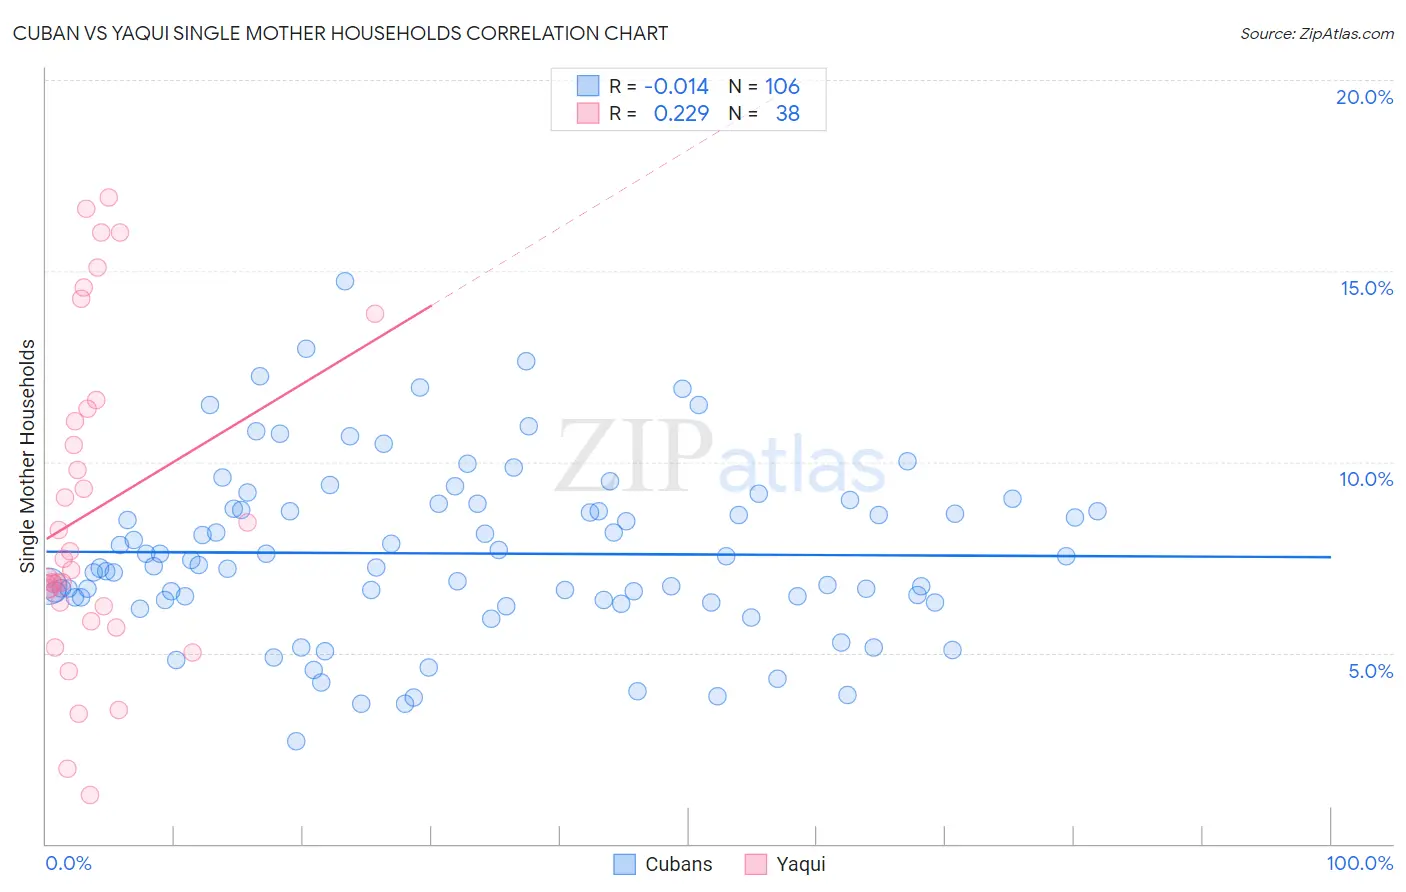
Cuban vs Yaqui Single Mother Households Correlation Chart
The statistical analysis conducted on geographies consisting of 447,599,583 people shows no correlation between the proportion of Cubans and percentage of single mother households in the United States with a correlation coefficient (R) of -0.014 and weighted average of 7.2%. Similarly, the statistical analysis conducted on geographies consisting of 107,663,122 people shows a weak positive correlation between the proportion of Yaqui and percentage of single mother households in the United States with a correlation coefficient (R) of 0.229 and weighted average of 7.4%, a difference of 3.3%.
Single Mother Households Correlation Summary
| Measurement | Cuban | Yaqui |
| Minimum | 2.7% | 1.3% |
| Maximum | 14.7% | 16.9% |
| Range | 12.0% | 15.6% |
| Mean | 7.6% | 8.7% |
| Median | 7.3% | 7.3% |
| Interquartile 25% (IQ1) | 6.4% | 6.2% |
| Interquartile 75% (IQ3) | 8.8% | 11.4% |
| Interquartile Range (IQR) | 2.4% | 5.2% |
| Standard Deviation (Sample) | 2.3% | 4.2% |
| Standard Deviation (Population) | 2.2% | 4.2% |
Demographics Similar to Cubans and Yaqui by Single Mother Households
In terms of single mother households, the demographic groups most similar to Cubans are Immigrants from Cambodia (7.2%, a difference of 0.34%), Nicaraguan (7.2%, a difference of 0.53%), Dutch West Indian (7.3%, a difference of 0.78%), Spanish American Indian (7.3%, a difference of 0.81%), and Bermudan (7.3%, a difference of 1.1%). Similarly, the demographic groups most similar to Yaqui are Immigrants from Nicaragua (7.4%, a difference of 0.080%), Immigrants from Somalia (7.4%, a difference of 0.23%), Japanese (7.4%, a difference of 0.43%), Immigrants from Zaire (7.4%, a difference of 0.45%), and Immigrants from Yemen (7.4%, a difference of 0.49%).
| Demographics | Rating | Rank | Single Mother Households |
| Cubans | 0.6 /100 | #244 | Tragic 7.2% |
| Immigrants | Cambodia | 0.5 /100 | #245 | Tragic 7.2% |
| Nicaraguans | 0.5 /100 | #246 | Tragic 7.2% |
| Dutch West Indians | 0.4 /100 | #247 | Tragic 7.3% |
| Spanish American Indians | 0.4 /100 | #248 | Tragic 7.3% |
| Bermudans | 0.4 /100 | #249 | Tragic 7.3% |
| Immigrants | Africa | 0.4 /100 | #250 | Tragic 7.3% |
| Malaysians | 0.3 /100 | #251 | Tragic 7.3% |
| Alaskan Athabascans | 0.3 /100 | #252 | Tragic 7.3% |
| Cajuns | 0.3 /100 | #253 | Tragic 7.3% |
| Immigrants | Ecuador | 0.3 /100 | #254 | Tragic 7.3% |
| Mexican American Indians | 0.2 /100 | #255 | Tragic 7.4% |
| Seminole | 0.2 /100 | #256 | Tragic 7.4% |
| Alaska Natives | 0.2 /100 | #257 | Tragic 7.4% |
| Pueblo | 0.2 /100 | #258 | Tragic 7.4% |
| Immigrants | Yemen | 0.2 /100 | #259 | Tragic 7.4% |
| Immigrants | Zaire | 0.2 /100 | #260 | Tragic 7.4% |
| Japanese | 0.2 /100 | #261 | Tragic 7.4% |
| Immigrants | Somalia | 0.2 /100 | #262 | Tragic 7.4% |
| Immigrants | Nicaragua | 0.2 /100 | #263 | Tragic 7.4% |
| Yaqui | 0.1 /100 | #264 | Tragic 7.4% |