Immigrants from Iran vs Inupiat Unemployment Among Ages 30 to 34 years
COMPARE
Immigrants from Iran
Inupiat
Unemployment Among Ages 30 to 34 years
Unemployment Among Ages 30 to 34 years Comparison
Immigrants from Iran
Inupiat
5.4%
UNEMPLOYMENT AMONG AGES 30 TO 34 YEARS
69.1/ 100
METRIC RATING
148th/ 347
METRIC RANK
10.8%
UNEMPLOYMENT AMONG AGES 30 TO 34 YEARS
0.0/ 100
METRIC RATING
343rd/ 347
METRIC RANK
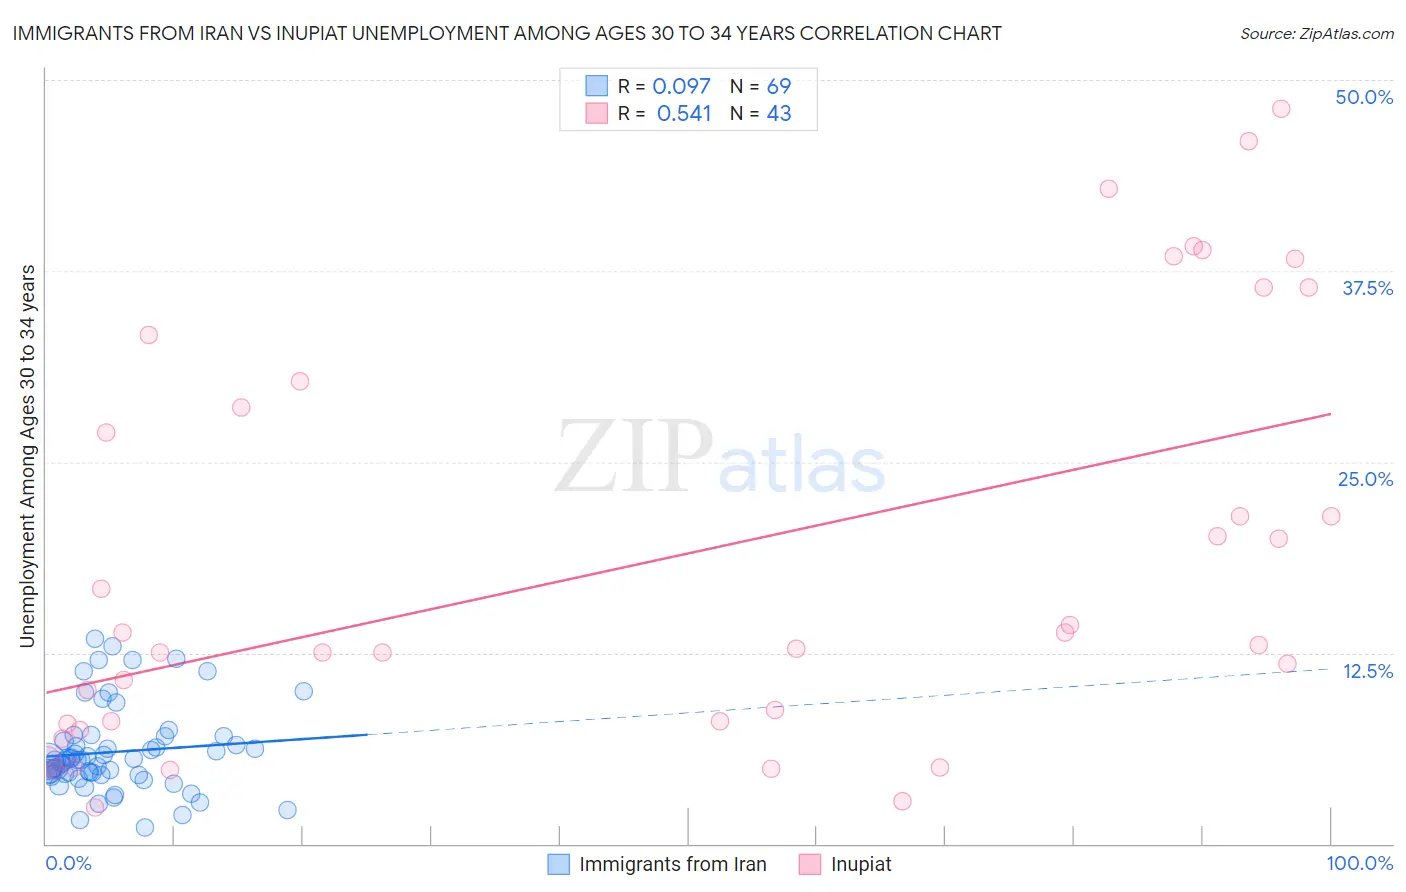
Immigrants from Iran vs Inupiat Unemployment Among Ages 30 to 34 years Correlation Chart
The statistical analysis conducted on geographies consisting of 270,613,388 people shows a slight positive correlation between the proportion of Immigrants from Iran and unemployment rate among population between the ages 30 and 34 in the United States with a correlation coefficient (R) of 0.097 and weighted average of 5.4%. Similarly, the statistical analysis conducted on geographies consisting of 94,650,433 people shows a substantial positive correlation between the proportion of Inupiat and unemployment rate among population between the ages 30 and 34 in the United States with a correlation coefficient (R) of 0.541 and weighted average of 10.8%, a difference of 101.0%.
Unemployment Among Ages 30 to 34 years Correlation Summary
| Measurement | Immigrants from Iran | Inupiat |
| Minimum | 1.1% | 2.4% |
| Maximum | 13.4% | 48.1% |
| Range | 12.3% | 45.7% |
| Mean | 6.0% | 18.7% |
| Median | 5.5% | 13.0% |
| Interquartile 25% (IQ1) | 4.6% | 7.9% |
| Interquartile 75% (IQ3) | 6.9% | 30.3% |
| Interquartile Range (IQR) | 2.3% | 22.4% |
| Standard Deviation (Sample) | 2.8% | 13.6% |
| Standard Deviation (Population) | 2.7% | 13.4% |
Similar Demographics by Unemployment Among Ages 30 to 34 years
Demographics Similar to Immigrants from Iran by Unemployment Among Ages 30 to 34 years
In terms of unemployment among ages 30 to 34 years, the demographic groups most similar to Immigrants from Iran are Ukrainian (5.4%, a difference of 0.010%), Immigrants from Colombia (5.4%, a difference of 0.020%), Colombian (5.4%, a difference of 0.030%), Immigrants from Oceania (5.4%, a difference of 0.080%), and Celtic (5.4%, a difference of 0.090%).
| Demographics | Rating | Rank | Unemployment Among Ages 30 to 34 years |
| Immigrants | Europe | 72.1 /100 | #141 | Good 5.4% |
| Immigrants | Greece | 72.0 /100 | #142 | Good 5.4% |
| Russians | 71.1 /100 | #143 | Good 5.4% |
| Immigrants | Russia | 71.0 /100 | #144 | Good 5.4% |
| Syrians | 70.3 /100 | #145 | Good 5.4% |
| Celtics | 70.2 /100 | #146 | Good 5.4% |
| Ukrainians | 69.2 /100 | #147 | Good 5.4% |
| Immigrants | Iran | 69.1 /100 | #148 | Good 5.4% |
| Immigrants | Colombia | 68.9 /100 | #149 | Good 5.4% |
| Colombians | 68.7 /100 | #150 | Good 5.4% |
| Immigrants | Oceania | 68.1 /100 | #151 | Good 5.4% |
| Lebanese | 67.2 /100 | #152 | Good 5.4% |
| Immigrants | South Eastern Asia | 66.5 /100 | #153 | Good 5.4% |
| South Africans | 66.5 /100 | #154 | Good 5.4% |
| Immigrants | Hungary | 66.1 /100 | #155 | Good 5.4% |
Demographics Similar to Inupiat by Unemployment Among Ages 30 to 34 years
In terms of unemployment among ages 30 to 34 years, the demographic groups most similar to Inupiat are Yuman (10.6%, a difference of 2.1%), Navajo (10.6%, a difference of 2.5%), Crow (10.3%, a difference of 4.6%), Tohono O'odham (9.8%, a difference of 10.1%), and Hopi (11.9%, a difference of 10.3%).
| Demographics | Rating | Rank | Unemployment Among Ages 30 to 34 years |
| Pueblo | 0.0 /100 | #333 | Tragic 8.3% |
| Alaska Natives | 0.0 /100 | #334 | Tragic 8.5% |
| Puerto Ricans | 0.0 /100 | #335 | Tragic 8.9% |
| Colville | 0.0 /100 | #336 | Tragic 9.0% |
| Pima | 0.0 /100 | #337 | Tragic 9.6% |
| Yakama | 0.0 /100 | #338 | Tragic 9.8% |
| Tohono O'odham | 0.0 /100 | #339 | Tragic 9.8% |
| Crow | 0.0 /100 | #340 | Tragic 10.3% |
| Navajo | 0.0 /100 | #341 | Tragic 10.6% |
| Yuman | 0.0 /100 | #342 | Tragic 10.6% |
| Inupiat | 0.0 /100 | #343 | Tragic 10.8% |
| Hopi | 0.0 /100 | #344 | Tragic 11.9% |
| Arapaho | 0.0 /100 | #345 | Tragic 12.8% |
| Tsimshian | 0.0 /100 | #346 | Tragic 13.8% |
| Yup'ik | 0.0 /100 | #347 | Tragic 18.5% |