Immigrants from Peru vs American Unemployment Among Ages 35 to 44 years
COMPARE
Immigrants from Peru
American
Unemployment Among Ages 35 to 44 years
Unemployment Among Ages 35 to 44 years Comparison
Immigrants from Peru
Americans
4.7%
UNEMPLOYMENT AMONG AGES 35 TO 44 YEARS
39.9/ 100
METRIC RATING
180th/ 347
METRIC RANK
4.9%
UNEMPLOYMENT AMONG AGES 35 TO 44 YEARS
6.2/ 100
METRIC RATING
216th/ 347
METRIC RANK
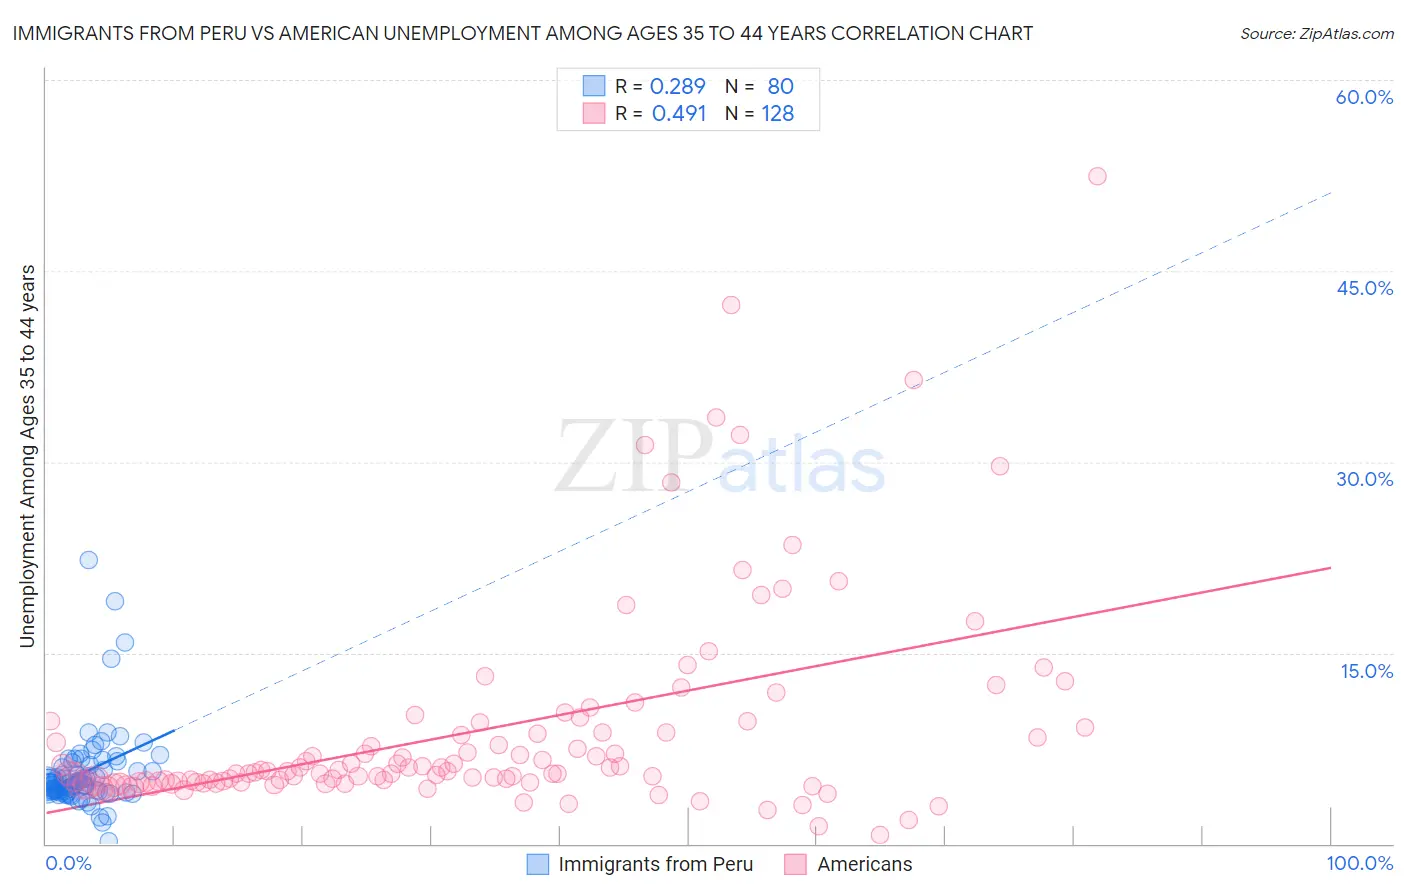
Immigrants from Peru vs American Unemployment Among Ages 35 to 44 years Correlation Chart
The statistical analysis conducted on geographies consisting of 324,077,342 people shows a weak positive correlation between the proportion of Immigrants from Peru and unemployment rate among population between the ages 35 and 44 in the United States with a correlation coefficient (R) of 0.289 and weighted average of 4.7%. Similarly, the statistical analysis conducted on geographies consisting of 538,964,660 people shows a moderate positive correlation between the proportion of Americans and unemployment rate among population between the ages 35 and 44 in the United States with a correlation coefficient (R) of 0.491 and weighted average of 4.9%, a difference of 4.1%.
Unemployment Among Ages 35 to 44 years Correlation Summary
| Measurement | Immigrants from Peru | American |
| Minimum | 0.20% | 0.70% |
| Maximum | 22.3% | 52.4% |
| Range | 22.1% | 51.7% |
| Mean | 5.6% | 8.9% |
| Median | 4.7% | 5.7% |
| Interquartile 25% (IQ1) | 4.1% | 4.8% |
| Interquartile 75% (IQ3) | 6.3% | 8.9% |
| Interquartile Range (IQR) | 2.2% | 4.1% |
| Standard Deviation (Sample) | 3.3% | 8.3% |
| Standard Deviation (Population) | 3.3% | 8.3% |
Similar Demographics by Unemployment Among Ages 35 to 44 years
Demographics Similar to Immigrants from Peru by Unemployment Among Ages 35 to 44 years
In terms of unemployment among ages 35 to 44 years, the demographic groups most similar to Immigrants from Peru are Immigrants from South Eastern Asia (4.7%, a difference of 0.020%), Brazilian (4.7%, a difference of 0.020%), South American Indian (4.7%, a difference of 0.060%), Israeli (4.7%, a difference of 0.10%), and Immigrants from Poland (4.7%, a difference of 0.15%).
| Demographics | Rating | Rank | Unemployment Among Ages 35 to 44 years |
| Iraqis | 50.9 /100 | #173 | Average 4.7% |
| Afghans | 50.0 /100 | #174 | Average 4.7% |
| Immigrants | Germany | 48.9 /100 | #175 | Average 4.7% |
| Immigrants | Uganda | 48.1 /100 | #176 | Average 4.7% |
| Slovaks | 44.6 /100 | #177 | Average 4.7% |
| South American Indians | 40.7 /100 | #178 | Average 4.7% |
| Immigrants | South Eastern Asia | 40.2 /100 | #179 | Average 4.7% |
| Immigrants | Peru | 39.9 /100 | #180 | Fair 4.7% |
| Brazilians | 39.5 /100 | #181 | Fair 4.7% |
| Israelis | 38.5 /100 | #182 | Fair 4.7% |
| Immigrants | Poland | 37.9 /100 | #183 | Fair 4.7% |
| Immigrants | Zaire | 37.3 /100 | #184 | Fair 4.7% |
| Immigrants | Costa Rica | 37.0 /100 | #185 | Fair 4.7% |
| Cypriots | 36.5 /100 | #186 | Fair 4.7% |
| Malaysians | 35.5 /100 | #187 | Fair 4.7% |
Demographics Similar to Americans by Unemployment Among Ages 35 to 44 years
In terms of unemployment among ages 35 to 44 years, the demographic groups most similar to Americans are Moroccan (4.9%, a difference of 0.040%), Chickasaw (4.9%, a difference of 0.15%), Sierra Leonean (4.9%, a difference of 0.46%), Immigrants (4.9%, a difference of 0.47%), and Immigrants from Sierra Leone (4.9%, a difference of 0.49%).
| Demographics | Rating | Rank | Unemployment Among Ages 35 to 44 years |
| Immigrants | Uruguay | 11.5 /100 | #209 | Poor 4.9% |
| Immigrants | Cameroon | 11.4 /100 | #210 | Poor 4.9% |
| Immigrants | Nonimmigrants | 9.4 /100 | #211 | Tragic 4.9% |
| Fijians | 8.7 /100 | #212 | Tragic 4.9% |
| Osage | 8.6 /100 | #213 | Tragic 4.9% |
| Immigrants | Africa | 8.2 /100 | #214 | Tragic 4.9% |
| Immigrants | Immigrants | 8.0 /100 | #215 | Tragic 4.9% |
| Americans | 6.2 /100 | #216 | Tragic 4.9% |
| Moroccans | 6.0 /100 | #217 | Tragic 4.9% |
| Chickasaw | 5.7 /100 | #218 | Tragic 4.9% |
| Sierra Leoneans | 4.8 /100 | #219 | Tragic 4.9% |
| Immigrants | Sierra Leone | 4.7 /100 | #220 | Tragic 4.9% |
| Bermudans | 3.9 /100 | #221 | Tragic 5.0% |
| Hmong | 3.5 /100 | #222 | Tragic 5.0% |
| Immigrants | Panama | 3.3 /100 | #223 | Tragic 5.0% |