Crow vs Immigrants from Germany Unemployment Among Ages 30 to 34 years
COMPARE
Crow
Immigrants from Germany
Unemployment Among Ages 30 to 34 years
Unemployment Among Ages 30 to 34 years Comparison
Crow
Immigrants from Germany
10.3%
UNEMPLOYMENT AMONG AGES 30 TO 34 YEARS
0.0/ 100
METRIC RATING
340th/ 347
METRIC RANK
5.6%
UNEMPLOYMENT AMONG AGES 30 TO 34 YEARS
22.9/ 100
METRIC RATING
202nd/ 347
METRIC RANK
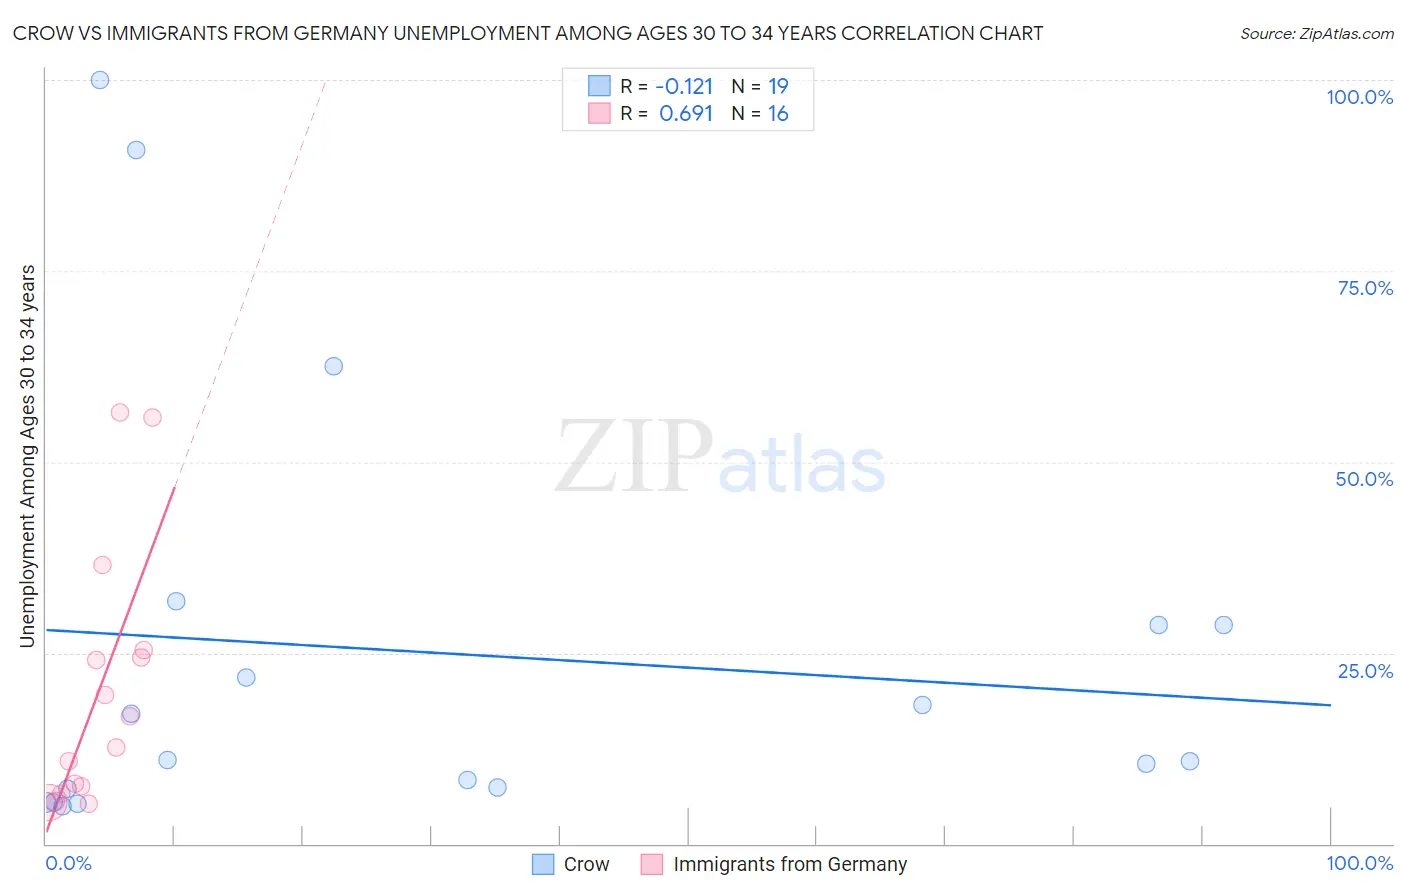
Crow vs Immigrants from Germany Unemployment Among Ages 30 to 34 years Correlation Chart
The statistical analysis conducted on geographies consisting of 58,132,383 people shows a poor negative correlation between the proportion of Crow and unemployment rate among population between the ages 30 and 34 in the United States with a correlation coefficient (R) of -0.121 and weighted average of 10.3%. Similarly, the statistical analysis conducted on geographies consisting of 427,761,430 people shows a significant positive correlation between the proportion of Immigrants from Germany and unemployment rate among population between the ages 30 and 34 in the United States with a correlation coefficient (R) of 0.691 and weighted average of 5.6%, a difference of 85.5%.
Unemployment Among Ages 30 to 34 years Correlation Summary
| Measurement | Crow | Immigrants from Germany |
| Minimum | 4.9% | 5.2% |
| Maximum | 100.0% | 56.5% |
| Range | 95.1% | 51.3% |
| Mean | 25.0% | 20.0% |
| Median | 10.9% | 14.7% |
| Interquartile 25% (IQ1) | 7.1% | 7.1% |
| Interquartile 75% (IQ3) | 28.6% | 24.8% |
| Interquartile Range (IQR) | 21.5% | 17.7% |
| Standard Deviation (Sample) | 28.5% | 16.8% |
| Standard Deviation (Population) | 27.8% | 16.2% |
Similar Demographics by Unemployment Among Ages 30 to 34 years
Demographics Similar to Crow by Unemployment Among Ages 30 to 34 years
In terms of unemployment among ages 30 to 34 years, the demographic groups most similar to Crow are Navajo (10.6%, a difference of 2.0%), Yuman (10.6%, a difference of 2.4%), Inupiat (10.8%, a difference of 4.6%), Tohono O'odham (9.8%, a difference of 5.2%), and Yakama (9.8%, a difference of 6.0%).
| Demographics | Rating | Rank | Unemployment Among Ages 30 to 34 years |
| Pueblo | 0.0 /100 | #333 | Tragic 8.3% |
| Alaska Natives | 0.0 /100 | #334 | Tragic 8.5% |
| Puerto Ricans | 0.0 /100 | #335 | Tragic 8.9% |
| Colville | 0.0 /100 | #336 | Tragic 9.0% |
| Pima | 0.0 /100 | #337 | Tragic 9.6% |
| Yakama | 0.0 /100 | #338 | Tragic 9.8% |
| Tohono O'odham | 0.0 /100 | #339 | Tragic 9.8% |
| Crow | 0.0 /100 | #340 | Tragic 10.3% |
| Navajo | 0.0 /100 | #341 | Tragic 10.6% |
| Yuman | 0.0 /100 | #342 | Tragic 10.6% |
| Inupiat | 0.0 /100 | #343 | Tragic 10.8% |
| Hopi | 0.0 /100 | #344 | Tragic 11.9% |
| Arapaho | 0.0 /100 | #345 | Tragic 12.8% |
| Tsimshian | 0.0 /100 | #346 | Tragic 13.8% |
| Yup'ik | 0.0 /100 | #347 | Tragic 18.5% |
Demographics Similar to Immigrants from Germany by Unemployment Among Ages 30 to 34 years
In terms of unemployment among ages 30 to 34 years, the demographic groups most similar to Immigrants from Germany are South American Indian (5.6%, a difference of 0.14%), Korean (5.6%, a difference of 0.22%), Immigrants from Southern Europe (5.6%, a difference of 0.27%), Nicaraguan (5.6%, a difference of 0.34%), and Immigrants from Afghanistan (5.6%, a difference of 0.39%).
| Demographics | Rating | Rank | Unemployment Among Ages 30 to 34 years |
| Finns | 30.7 /100 | #195 | Fair 5.5% |
| Immigrants | South America | 29.8 /100 | #196 | Fair 5.5% |
| Immigrants | Nicaragua | 28.9 /100 | #197 | Fair 5.5% |
| Immigrants | Afghanistan | 27.2 /100 | #198 | Fair 5.6% |
| Nicaraguans | 26.6 /100 | #199 | Fair 5.6% |
| Immigrants | Southern Europe | 25.8 /100 | #200 | Fair 5.6% |
| South American Indians | 24.4 /100 | #201 | Fair 5.6% |
| Immigrants | Germany | 22.9 /100 | #202 | Fair 5.6% |
| Koreans | 20.7 /100 | #203 | Fair 5.6% |
| Immigrants | Cameroon | 18.4 /100 | #204 | Poor 5.6% |
| Immigrants | Costa Rica | 14.4 /100 | #205 | Poor 5.6% |
| Alsatians | 14.3 /100 | #206 | Poor 5.6% |
| Israelis | 12.8 /100 | #207 | Poor 5.6% |
| Immigrants | Philippines | 11.5 /100 | #208 | Poor 5.7% |
| French | 10.8 /100 | #209 | Poor 5.7% |