Okinawan vs Panamanian Unemployment Among Seniors over 75 years
COMPARE
Okinawan
Panamanian
Unemployment Among Seniors over 75 years
Unemployment Among Seniors over 75 years Comparison
Okinawans
Panamanians
8.8%
UNEMPLOYMENT AMONG SENIORS OVER 75 YEARS
28.9/ 100
METRIC RATING
195th/ 347
METRIC RANK
9.1%
UNEMPLOYMENT AMONG SENIORS OVER 75 YEARS
4.0/ 100
METRIC RATING
235th/ 347
METRIC RANK
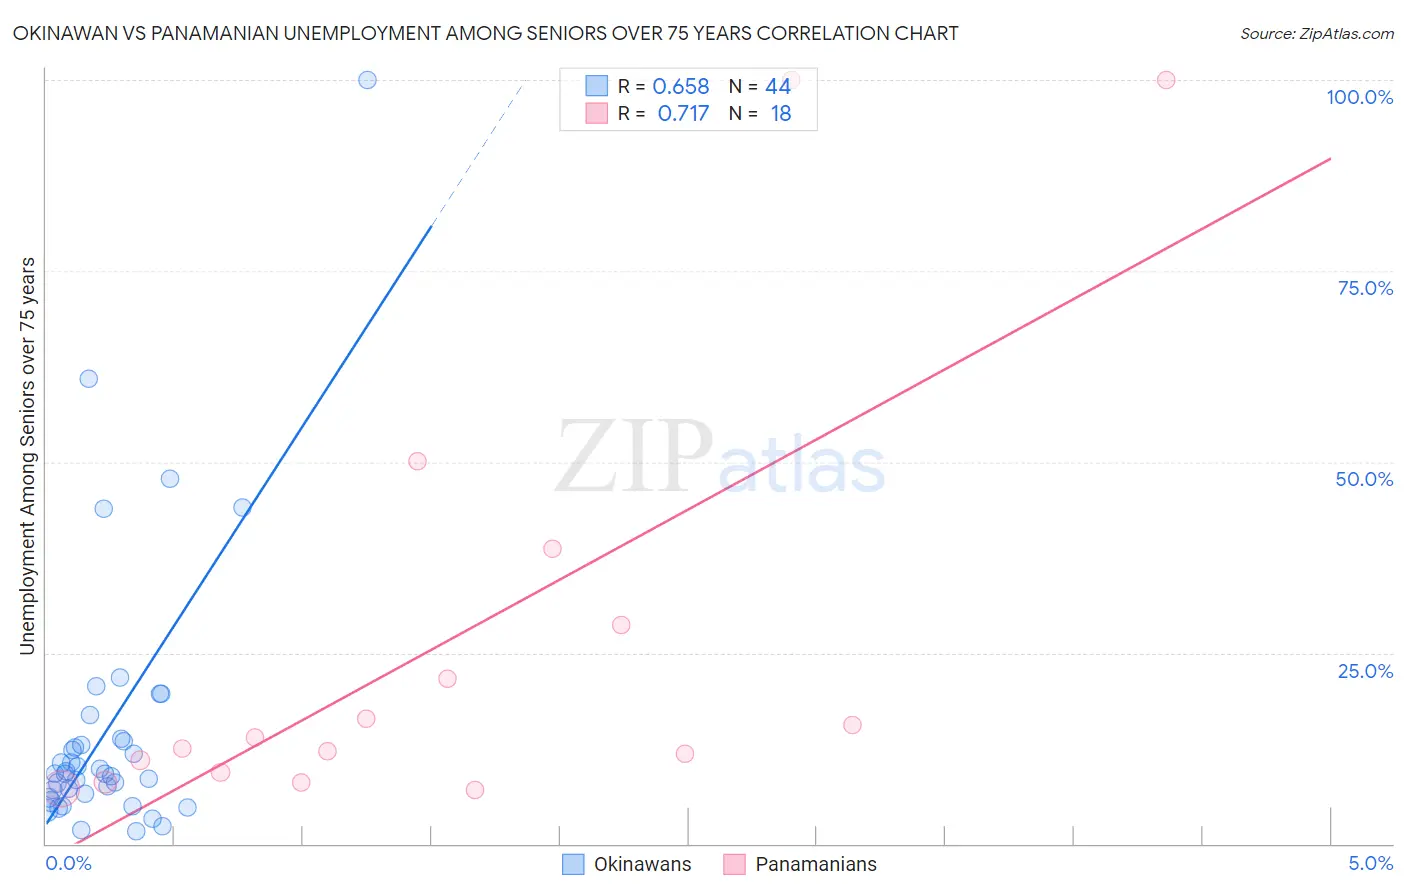
Okinawan vs Panamanian Unemployment Among Seniors over 75 years Correlation Chart
The statistical analysis conducted on geographies consisting of 59,425,969 people shows a significant positive correlation between the proportion of Okinawans and unemployment rate among seniors over the age of 75 in the United States with a correlation coefficient (R) of 0.658 and weighted average of 8.8%. Similarly, the statistical analysis conducted on geographies consisting of 160,542,886 people shows a strong positive correlation between the proportion of Panamanians and unemployment rate among seniors over the age of 75 in the United States with a correlation coefficient (R) of 0.717 and weighted average of 9.1%, a difference of 3.0%.
Unemployment Among Seniors over 75 years Correlation Summary
| Measurement | Okinawan | Panamanian |
| Minimum | 1.6% | 7.1% |
| Maximum | 100.0% | 100.0% |
| Range | 98.4% | 92.9% |
| Mean | 15.1% | 26.2% |
| Median | 9.1% | 13.2% |
| Interquartile 25% (IQ1) | 6.3% | 9.4% |
| Interquartile 75% (IQ3) | 13.6% | 28.6% |
| Interquartile Range (IQR) | 7.3% | 19.2% |
| Standard Deviation (Sample) | 18.2% | 29.2% |
| Standard Deviation (Population) | 18.0% | 28.4% |
Similar Demographics by Unemployment Among Seniors over 75 years
Demographics Similar to Okinawans by Unemployment Among Seniors over 75 years
In terms of unemployment among seniors over 75 years, the demographic groups most similar to Okinawans are Maltese (8.8%, a difference of 0.020%), Immigrants from Guyana (8.8%, a difference of 0.070%), Immigrants from Jamaica (8.9%, a difference of 0.070%), Immigrants from Laos (8.9%, a difference of 0.17%), and Immigrants from Kenya (8.8%, a difference of 0.18%).
| Demographics | Rating | Rank | Unemployment Among Seniors over 75 years |
| Immigrants | Eastern Europe | 34.7 /100 | #188 | Fair 8.8% |
| Immigrants | Haiti | 34.7 /100 | #189 | Fair 8.8% |
| Mexican American Indians | 34.7 /100 | #190 | Fair 8.8% |
| Estonians | 33.3 /100 | #191 | Fair 8.8% |
| Immigrants | Kenya | 31.8 /100 | #192 | Fair 8.8% |
| Immigrants | Guyana | 29.9 /100 | #193 | Fair 8.8% |
| Maltese | 29.2 /100 | #194 | Fair 8.8% |
| Okinawans | 28.9 /100 | #195 | Fair 8.8% |
| Immigrants | Jamaica | 27.7 /100 | #196 | Fair 8.9% |
| Immigrants | Laos | 26.3 /100 | #197 | Fair 8.9% |
| Eastern Europeans | 25.9 /100 | #198 | Fair 8.9% |
| Pakistanis | 25.4 /100 | #199 | Fair 8.9% |
| Osage | 25.4 /100 | #200 | Fair 8.9% |
| Immigrants | Peru | 24.3 /100 | #201 | Fair 8.9% |
| Russians | 24.1 /100 | #202 | Fair 8.9% |
Demographics Similar to Panamanians by Unemployment Among Seniors over 75 years
In terms of unemployment among seniors over 75 years, the demographic groups most similar to Panamanians are Jordanian (9.1%, a difference of 0.010%), Houma (9.1%, a difference of 0.040%), Inupiat (9.1%, a difference of 0.14%), Vietnamese (9.1%, a difference of 0.19%), and Mexican (9.1%, a difference of 0.20%).
| Demographics | Rating | Rank | Unemployment Among Seniors over 75 years |
| Kenyans | 5.4 /100 | #228 | Tragic 9.1% |
| Hispanics or Latinos | 5.0 /100 | #229 | Tragic 9.1% |
| Northern Europeans | 4.9 /100 | #230 | Tragic 9.1% |
| Immigrants | Central America | 4.9 /100 | #231 | Tragic 9.1% |
| Africans | 4.9 /100 | #232 | Tragic 9.1% |
| Yugoslavians | 4.8 /100 | #233 | Tragic 9.1% |
| Vietnamese | 4.6 /100 | #234 | Tragic 9.1% |
| Panamanians | 4.0 /100 | #235 | Tragic 9.1% |
| Jordanians | 4.0 /100 | #236 | Tragic 9.1% |
| Houma | 3.9 /100 | #237 | Tragic 9.1% |
| Inupiat | 3.6 /100 | #238 | Tragic 9.1% |
| Mexicans | 3.5 /100 | #239 | Tragic 9.1% |
| Spanish | 3.3 /100 | #240 | Tragic 9.1% |
| Immigrants | Southern Europe | 2.8 /100 | #241 | Tragic 9.2% |
| Sierra Leoneans | 2.8 /100 | #242 | Tragic 9.2% |