Crow vs Immigrants from Trinidad and Tobago Unemployment Among Ages 35 to 44 years
COMPARE
Crow
Immigrants from Trinidad and Tobago
Unemployment Among Ages 35 to 44 years
Unemployment Among Ages 35 to 44 years Comparison
Crow
Immigrants from Trinidad and Tobago
15.7%
UNEMPLOYMENT AMONG AGES 35 TO 44 YEARS
0.0/ 100
METRIC RATING
346th/ 347
METRIC RANK
5.6%
UNEMPLOYMENT AMONG AGES 35 TO 44 YEARS
0.0/ 100
METRIC RATING
296th/ 347
METRIC RANK
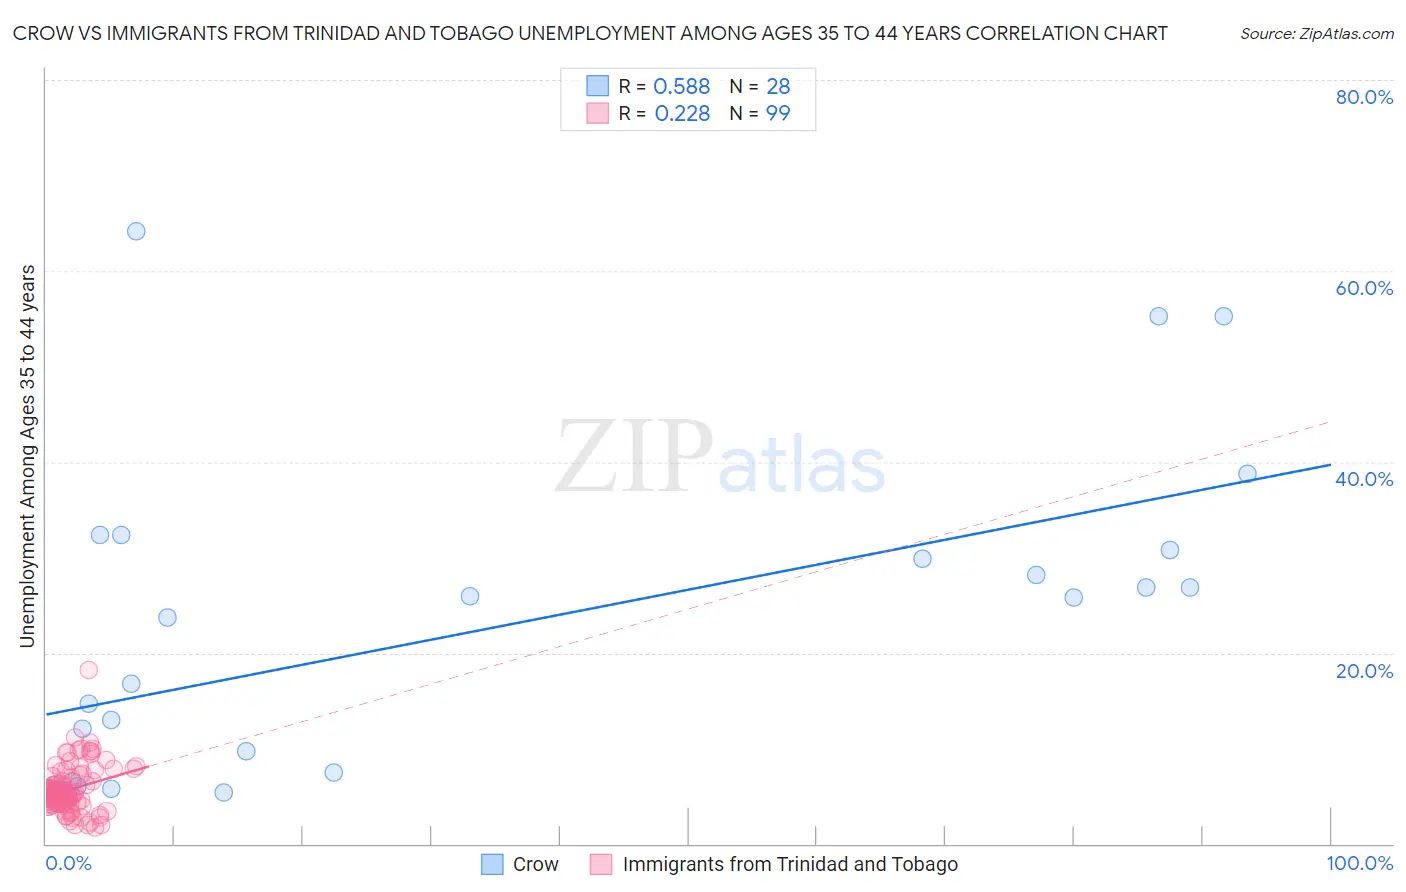
Crow vs Immigrants from Trinidad and Tobago Unemployment Among Ages 35 to 44 years Correlation Chart
The statistical analysis conducted on geographies consisting of 58,626,239 people shows a substantial positive correlation between the proportion of Crow and unemployment rate among population between the ages 35 and 44 in the United States with a correlation coefficient (R) of 0.588 and weighted average of 15.7%. Similarly, the statistical analysis conducted on geographies consisting of 221,225,098 people shows a weak positive correlation between the proportion of Immigrants from Trinidad and Tobago and unemployment rate among population between the ages 35 and 44 in the United States with a correlation coefficient (R) of 0.228 and weighted average of 5.6%, a difference of 181.9%.
Unemployment Among Ages 35 to 44 years Correlation Summary
| Measurement | Crow | Immigrants from Trinidad and Tobago |
| Minimum | 4.9% | 1.7% |
| Maximum | 64.2% | 18.2% |
| Range | 59.3% | 16.5% |
| Mean | 22.0% | 5.7% |
| Median | 20.2% | 5.1% |
| Interquartile 25% (IQ1) | 6.4% | 4.3% |
| Interquartile 75% (IQ3) | 30.3% | 6.9% |
| Interquartile Range (IQR) | 23.9% | 2.6% |
| Standard Deviation (Sample) | 16.7% | 2.5% |
| Standard Deviation (Population) | 16.4% | 2.5% |
Similar Demographics by Unemployment Among Ages 35 to 44 years
Demographics Similar to Crow by Unemployment Among Ages 35 to 44 years
In terms of unemployment among ages 35 to 44 years, the demographic groups most similar to Crow are Yuman (16.9%, a difference of 7.7%), Yup'ik (14.4%, a difference of 8.8%), Pima (11.8%, a difference of 33.6%), Arapaho (10.3%, a difference of 52.7%), and Navajo (9.3%, a difference of 68.2%).
| Demographics | Rating | Rank | Unemployment Among Ages 35 to 44 years |
| Puerto Ricans | 0.0 /100 | #333 | Tragic 7.6% |
| Houma | 0.0 /100 | #334 | Tragic 7.8% |
| Sioux | 0.0 /100 | #335 | Tragic 8.4% |
| Apache | 0.0 /100 | #336 | Tragic 8.4% |
| Tohono O'odham | 0.0 /100 | #337 | Tragic 8.4% |
| Cheyenne | 0.0 /100 | #338 | Tragic 8.5% |
| Inupiat | 0.0 /100 | #339 | Tragic 8.6% |
| Alaskan Athabascans | 0.0 /100 | #340 | Tragic 8.6% |
| Hopi | 0.0 /100 | #341 | Tragic 8.9% |
| Navajo | 0.0 /100 | #342 | Tragic 9.3% |
| Arapaho | 0.0 /100 | #343 | Tragic 10.3% |
| Pima | 0.0 /100 | #344 | Tragic 11.8% |
| Yup'ik | 0.0 /100 | #345 | Tragic 14.4% |
| Crow | 0.0 /100 | #346 | Tragic 15.7% |
| Yuman | 0.0 /100 | #347 | Tragic 16.9% |
Demographics Similar to Immigrants from Trinidad and Tobago by Unemployment Among Ages 35 to 44 years
In terms of unemployment among ages 35 to 44 years, the demographic groups most similar to Immigrants from Trinidad and Tobago are Ottawa (5.6%, a difference of 0.020%), U.S. Virgin Islander (5.6%, a difference of 0.11%), Aleut (5.6%, a difference of 0.12%), Immigrants from Jamaica (5.6%, a difference of 0.22%), and Trinidadian and Tobagonian (5.6%, a difference of 0.23%).
| Demographics | Rating | Rank | Unemployment Among Ages 35 to 44 years |
| Spanish American Indians | 0.0 /100 | #289 | Tragic 5.5% |
| Jamaicans | 0.0 /100 | #290 | Tragic 5.5% |
| Dutch West Indians | 0.0 /100 | #291 | Tragic 5.5% |
| Immigrants | Haiti | 0.0 /100 | #292 | Tragic 5.5% |
| Central American Indians | 0.0 /100 | #293 | Tragic 5.6% |
| Trinidadians and Tobagonians | 0.0 /100 | #294 | Tragic 5.6% |
| Ottawa | 0.0 /100 | #295 | Tragic 5.6% |
| Immigrants | Trinidad and Tobago | 0.0 /100 | #296 | Tragic 5.6% |
| U.S. Virgin Islanders | 0.0 /100 | #297 | Tragic 5.6% |
| Aleuts | 0.0 /100 | #298 | Tragic 5.6% |
| Immigrants | Jamaica | 0.0 /100 | #299 | Tragic 5.6% |
| Immigrants | West Indies | 0.0 /100 | #300 | Tragic 5.6% |
| Africans | 0.0 /100 | #301 | Tragic 5.6% |
| Nepalese | 0.0 /100 | #302 | Tragic 5.6% |
| Yakama | 0.0 /100 | #303 | Tragic 5.6% |