Afghan vs Immigrants from Germany Unemployment Among Ages 30 to 34 years
COMPARE
Afghan
Immigrants from Germany
Unemployment Among Ages 30 to 34 years
Unemployment Among Ages 30 to 34 years Comparison
Afghans
Immigrants from Germany
5.5%
UNEMPLOYMENT AMONG AGES 30 TO 34 YEARS
49.6/ 100
METRIC RATING
175th/ 347
METRIC RANK
5.6%
UNEMPLOYMENT AMONG AGES 30 TO 34 YEARS
22.9/ 100
METRIC RATING
202nd/ 347
METRIC RANK
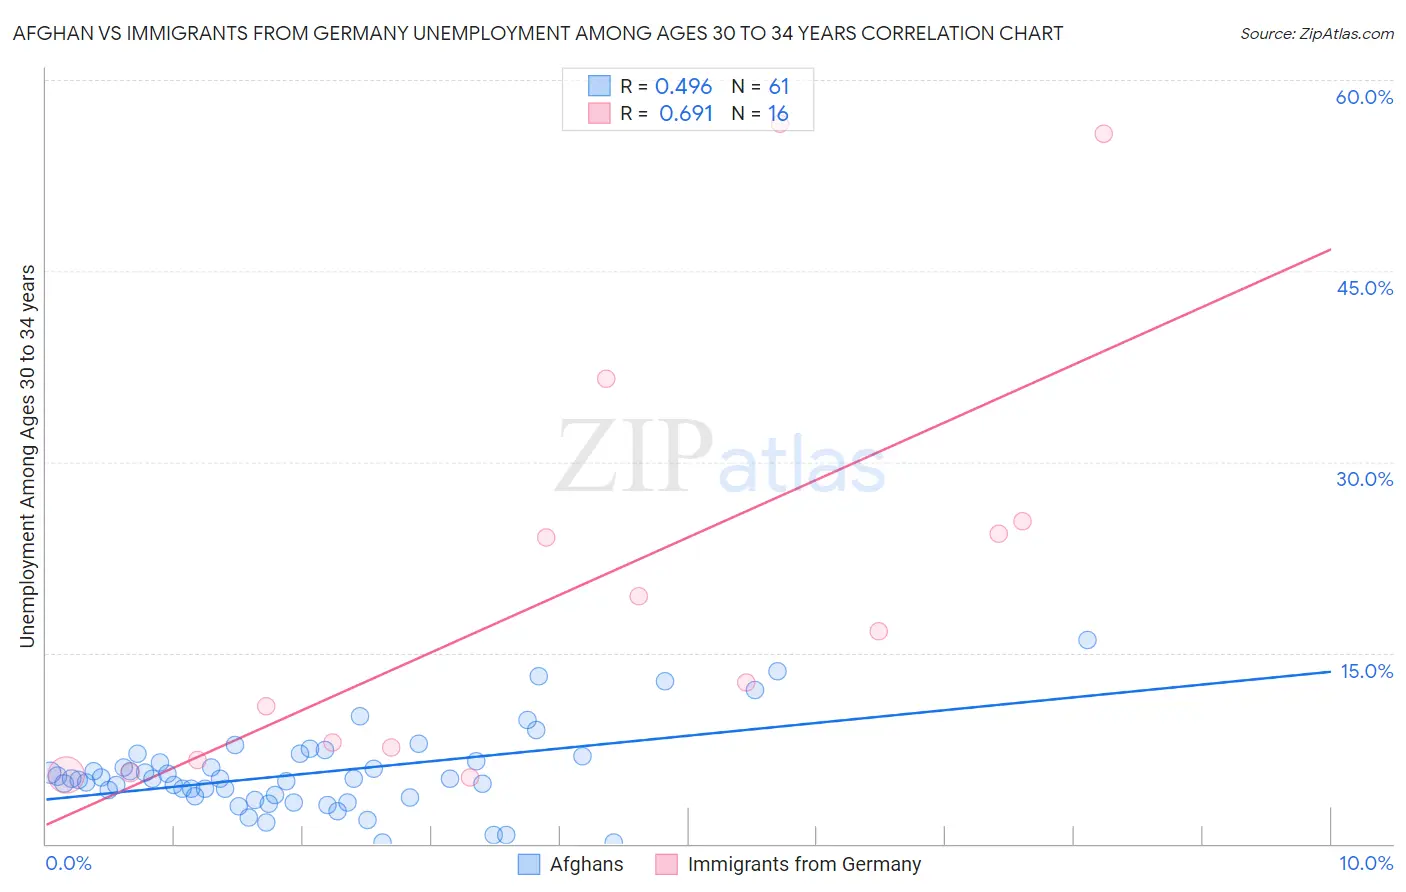
Afghan vs Immigrants from Germany Unemployment Among Ages 30 to 34 years Correlation Chart
The statistical analysis conducted on geographies consisting of 146,572,734 people shows a moderate positive correlation between the proportion of Afghans and unemployment rate among population between the ages 30 and 34 in the United States with a correlation coefficient (R) of 0.496 and weighted average of 5.5%. Similarly, the statistical analysis conducted on geographies consisting of 427,761,430 people shows a significant positive correlation between the proportion of Immigrants from Germany and unemployment rate among population between the ages 30 and 34 in the United States with a correlation coefficient (R) of 0.691 and weighted average of 5.6%, a difference of 2.1%.
Unemployment Among Ages 30 to 34 years Correlation Summary
| Measurement | Afghan | Immigrants from Germany |
| Minimum | 0.10% | 5.2% |
| Maximum | 16.0% | 56.5% |
| Range | 15.9% | 51.3% |
| Mean | 5.5% | 20.0% |
| Median | 5.1% | 14.7% |
| Interquartile 25% (IQ1) | 3.7% | 7.1% |
| Interquartile 75% (IQ3) | 6.7% | 24.8% |
| Interquartile Range (IQR) | 3.0% | 17.7% |
| Standard Deviation (Sample) | 3.2% | 16.8% |
| Standard Deviation (Population) | 3.2% | 16.2% |
Similar Demographics by Unemployment Among Ages 30 to 34 years
Demographics Similar to Afghans by Unemployment Among Ages 30 to 34 years
In terms of unemployment among ages 30 to 34 years, the demographic groups most similar to Afghans are Immigrants from Laos (5.5%, a difference of 0.030%), Peruvian (5.5%, a difference of 0.040%), Immigrants from Peru (5.5%, a difference of 0.11%), Immigrants from Austria (5.5%, a difference of 0.12%), and Immigrants from Ukraine (5.5%, a difference of 0.13%).
| Demographics | Rating | Rank | Unemployment Among Ages 30 to 34 years |
| South Americans | 52.9 /100 | #168 | Average 5.4% |
| Immigrants | Israel | 52.9 /100 | #169 | Average 5.4% |
| Dutch | 52.6 /100 | #170 | Average 5.5% |
| Scottish | 51.8 /100 | #171 | Average 5.5% |
| Immigrants | Austria | 51.3 /100 | #172 | Average 5.5% |
| Peruvians | 50.2 /100 | #173 | Average 5.5% |
| Immigrants | Laos | 50.0 /100 | #174 | Average 5.5% |
| Afghans | 49.6 /100 | #175 | Average 5.5% |
| Immigrants | Peru | 48.0 /100 | #176 | Average 5.5% |
| Immigrants | Ukraine | 47.7 /100 | #177 | Average 5.5% |
| Macedonians | 47.1 /100 | #178 | Average 5.5% |
| Costa Ricans | 46.7 /100 | #179 | Average 5.5% |
| Italians | 45.5 /100 | #180 | Average 5.5% |
| Immigrants | Lebanon | 43.5 /100 | #181 | Average 5.5% |
| Immigrants | Denmark | 43.4 /100 | #182 | Average 5.5% |
Demographics Similar to Immigrants from Germany by Unemployment Among Ages 30 to 34 years
In terms of unemployment among ages 30 to 34 years, the demographic groups most similar to Immigrants from Germany are South American Indian (5.6%, a difference of 0.14%), Korean (5.6%, a difference of 0.22%), Immigrants from Southern Europe (5.6%, a difference of 0.27%), Nicaraguan (5.6%, a difference of 0.34%), and Immigrants from Afghanistan (5.6%, a difference of 0.39%).
| Demographics | Rating | Rank | Unemployment Among Ages 30 to 34 years |
| Finns | 30.7 /100 | #195 | Fair 5.5% |
| Immigrants | South America | 29.8 /100 | #196 | Fair 5.5% |
| Immigrants | Nicaragua | 28.9 /100 | #197 | Fair 5.5% |
| Immigrants | Afghanistan | 27.2 /100 | #198 | Fair 5.6% |
| Nicaraguans | 26.6 /100 | #199 | Fair 5.6% |
| Immigrants | Southern Europe | 25.8 /100 | #200 | Fair 5.6% |
| South American Indians | 24.4 /100 | #201 | Fair 5.6% |
| Immigrants | Germany | 22.9 /100 | #202 | Fair 5.6% |
| Koreans | 20.7 /100 | #203 | Fair 5.6% |
| Immigrants | Cameroon | 18.4 /100 | #204 | Poor 5.6% |
| Immigrants | Costa Rica | 14.4 /100 | #205 | Poor 5.6% |
| Alsatians | 14.3 /100 | #206 | Poor 5.6% |
| Israelis | 12.8 /100 | #207 | Poor 5.6% |
| Immigrants | Philippines | 11.5 /100 | #208 | Poor 5.7% |
| French | 10.8 /100 | #209 | Poor 5.7% |