Immigrants from South Eastern Asia vs Costa Rican Unemployment Among Ages 20 to 24 years
COMPARE
Immigrants from South Eastern Asia
Costa Rican
Unemployment Among Ages 20 to 24 years
Unemployment Among Ages 20 to 24 years Comparison
Immigrants from South Eastern Asia
Costa Ricans
10.1%
UNEMPLOYMENT AMONG AGES 20 TO 24 YEARS
84.0/ 100
METRIC RATING
132nd/ 347
METRIC RANK
10.5%
UNEMPLOYMENT AMONG AGES 20 TO 24 YEARS
9.6/ 100
METRIC RATING
216th/ 347
METRIC RANK
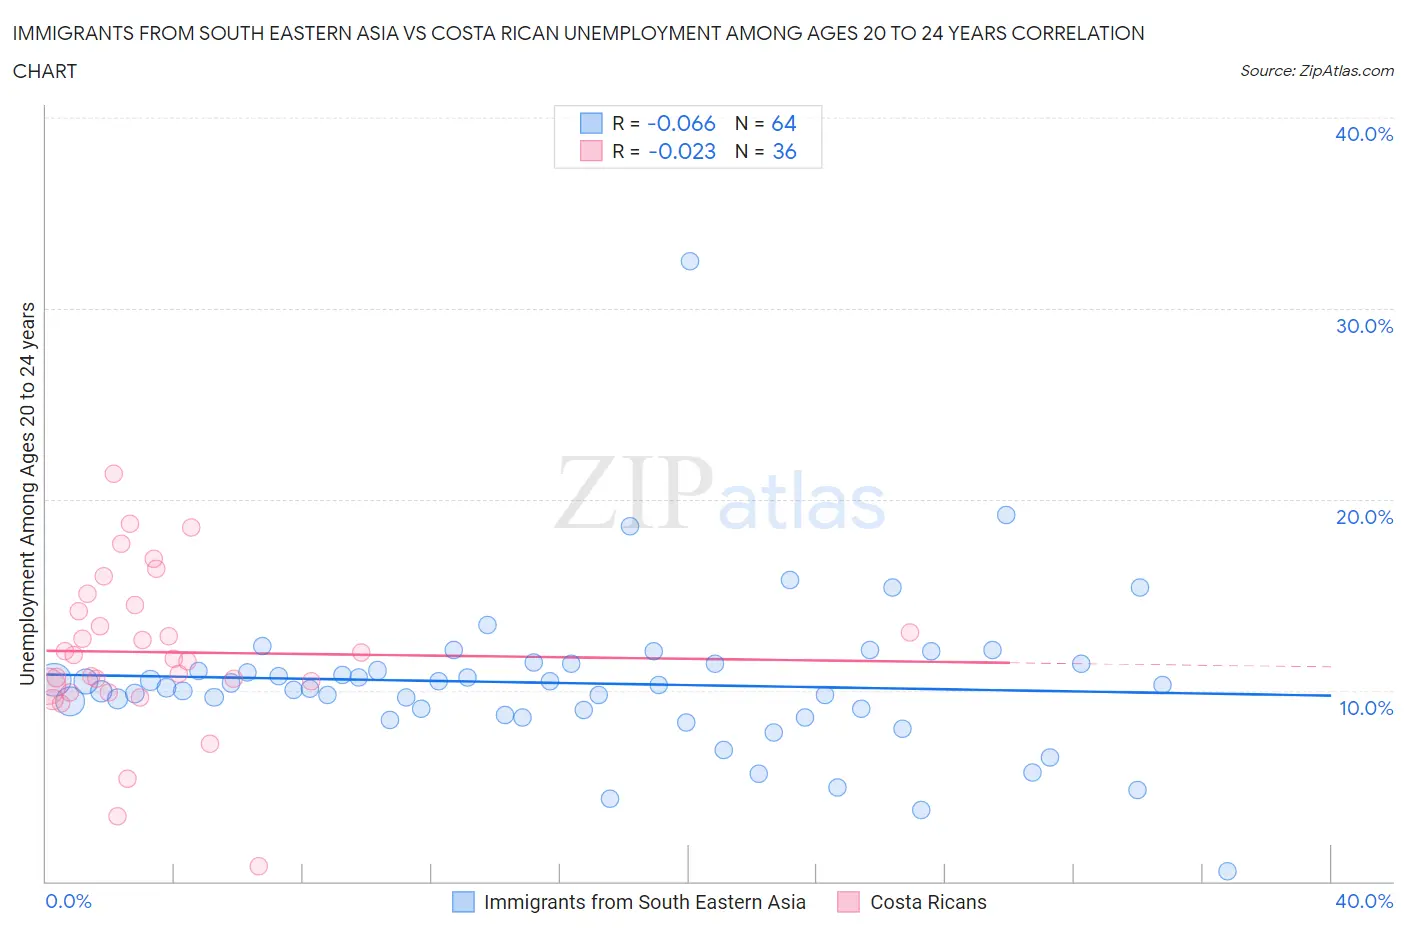
Immigrants from South Eastern Asia vs Costa Rican Unemployment Among Ages 20 to 24 years Correlation Chart
The statistical analysis conducted on geographies consisting of 486,283,362 people shows a slight negative correlation between the proportion of Immigrants from South Eastern Asia and unemployment rate among population between the ages 20 and 24 in the United States with a correlation coefficient (R) of -0.066 and weighted average of 10.1%. Similarly, the statistical analysis conducted on geographies consisting of 249,783,382 people shows no correlation between the proportion of Costa Ricans and unemployment rate among population between the ages 20 and 24 in the United States with a correlation coefficient (R) of -0.023 and weighted average of 10.5%, a difference of 3.6%.
Unemployment Among Ages 20 to 24 years Correlation Summary
| Measurement | Immigrants from South Eastern Asia | Costa Rican |
| Minimum | 0.50% | 0.80% |
| Maximum | 32.5% | 21.3% |
| Range | 32.0% | 20.5% |
| Mean | 10.4% | 12.0% |
| Median | 10.2% | 11.7% |
| Interquartile 25% (IQ1) | 8.8% | 10.1% |
| Interquartile 75% (IQ3) | 11.4% | 14.3% |
| Interquartile Range (IQR) | 2.6% | 4.3% |
| Standard Deviation (Sample) | 4.2% | 4.1% |
| Standard Deviation (Population) | 4.1% | 4.1% |
Similar Demographics by Unemployment Among Ages 20 to 24 years
Demographics Similar to Immigrants from South Eastern Asia by Unemployment Among Ages 20 to 24 years
In terms of unemployment among ages 20 to 24 years, the demographic groups most similar to Immigrants from South Eastern Asia are Immigrants from Lithuania (10.1%, a difference of 0.010%), Seminole (10.1%, a difference of 0.010%), Austrian (10.2%, a difference of 0.010%), Romanian (10.2%, a difference of 0.020%), and Immigrants from South Central Asia (10.1%, a difference of 0.040%).
| Demographics | Rating | Rank | Unemployment Among Ages 20 to 24 years |
| Spanish | 86.1 /100 | #125 | Excellent 10.1% |
| Jordanians | 86.1 /100 | #126 | Excellent 10.1% |
| Immigrants | Norway | 85.3 /100 | #127 | Excellent 10.1% |
| Immigrants | Brazil | 84.9 /100 | #128 | Excellent 10.1% |
| Immigrants | South Central Asia | 84.6 /100 | #129 | Excellent 10.1% |
| Immigrants | Lithuania | 84.2 /100 | #130 | Excellent 10.1% |
| Seminole | 84.2 /100 | #131 | Excellent 10.1% |
| Immigrants | South Eastern Asia | 84.0 /100 | #132 | Excellent 10.1% |
| Austrians | 83.9 /100 | #133 | Excellent 10.2% |
| Romanians | 83.8 /100 | #134 | Excellent 10.2% |
| Comanche | 83.4 /100 | #135 | Excellent 10.2% |
| Immigrants | Northern Africa | 82.5 /100 | #136 | Excellent 10.2% |
| Immigrants | North America | 82.5 /100 | #137 | Excellent 10.2% |
| Burmese | 82.3 /100 | #138 | Excellent 10.2% |
| Uruguayans | 81.9 /100 | #139 | Excellent 10.2% |
Demographics Similar to Costa Ricans by Unemployment Among Ages 20 to 24 years
In terms of unemployment among ages 20 to 24 years, the demographic groups most similar to Costa Ricans are Cherokee (10.5%, a difference of 0.030%), Honduran (10.5%, a difference of 0.090%), Nonimmigrants (10.5%, a difference of 0.090%), Immigrants from Southern Europe (10.5%, a difference of 0.18%), and Kiowa (10.5%, a difference of 0.20%).
| Demographics | Rating | Rank | Unemployment Among Ages 20 to 24 years |
| Peruvians | 17.2 /100 | #209 | Poor 10.5% |
| Immigrants | Belgium | 16.9 /100 | #210 | Poor 10.5% |
| Immigrants | Guatemala | 14.6 /100 | #211 | Poor 10.5% |
| Immigrants | Sri Lanka | 14.0 /100 | #212 | Poor 10.5% |
| Guatemalans | 12.2 /100 | #213 | Poor 10.5% |
| Kiowa | 11.7 /100 | #214 | Poor 10.5% |
| Hondurans | 10.5 /100 | #215 | Poor 10.5% |
| Costa Ricans | 9.6 /100 | #216 | Tragic 10.5% |
| Cherokee | 9.3 /100 | #217 | Tragic 10.5% |
| Immigrants | Nonimmigrants | 8.8 /100 | #218 | Tragic 10.5% |
| Immigrants | Southern Europe | 8.0 /100 | #219 | Tragic 10.5% |
| Eastern Europeans | 6.9 /100 | #220 | Tragic 10.6% |
| Central Americans | 6.8 /100 | #221 | Tragic 10.6% |
| Immigrants | Poland | 6.4 /100 | #222 | Tragic 10.6% |
| Arabs | 5.6 /100 | #223 | Tragic 10.6% |