Crow vs Immigrants from Singapore Unemployment Among Ages 20 to 24 years
COMPARE
Crow
Immigrants from Singapore
Unemployment Among Ages 20 to 24 years
Unemployment Among Ages 20 to 24 years Comparison
Crow
Immigrants from Singapore
18.7%
UNEMPLOYMENT AMONG AGES 20 TO 24 YEARS
0.0/ 100
METRIC RATING
344th/ 347
METRIC RANK
9.8%
UNEMPLOYMENT AMONG AGES 20 TO 24 YEARS
99.4/ 100
METRIC RATING
62nd/ 347
METRIC RANK
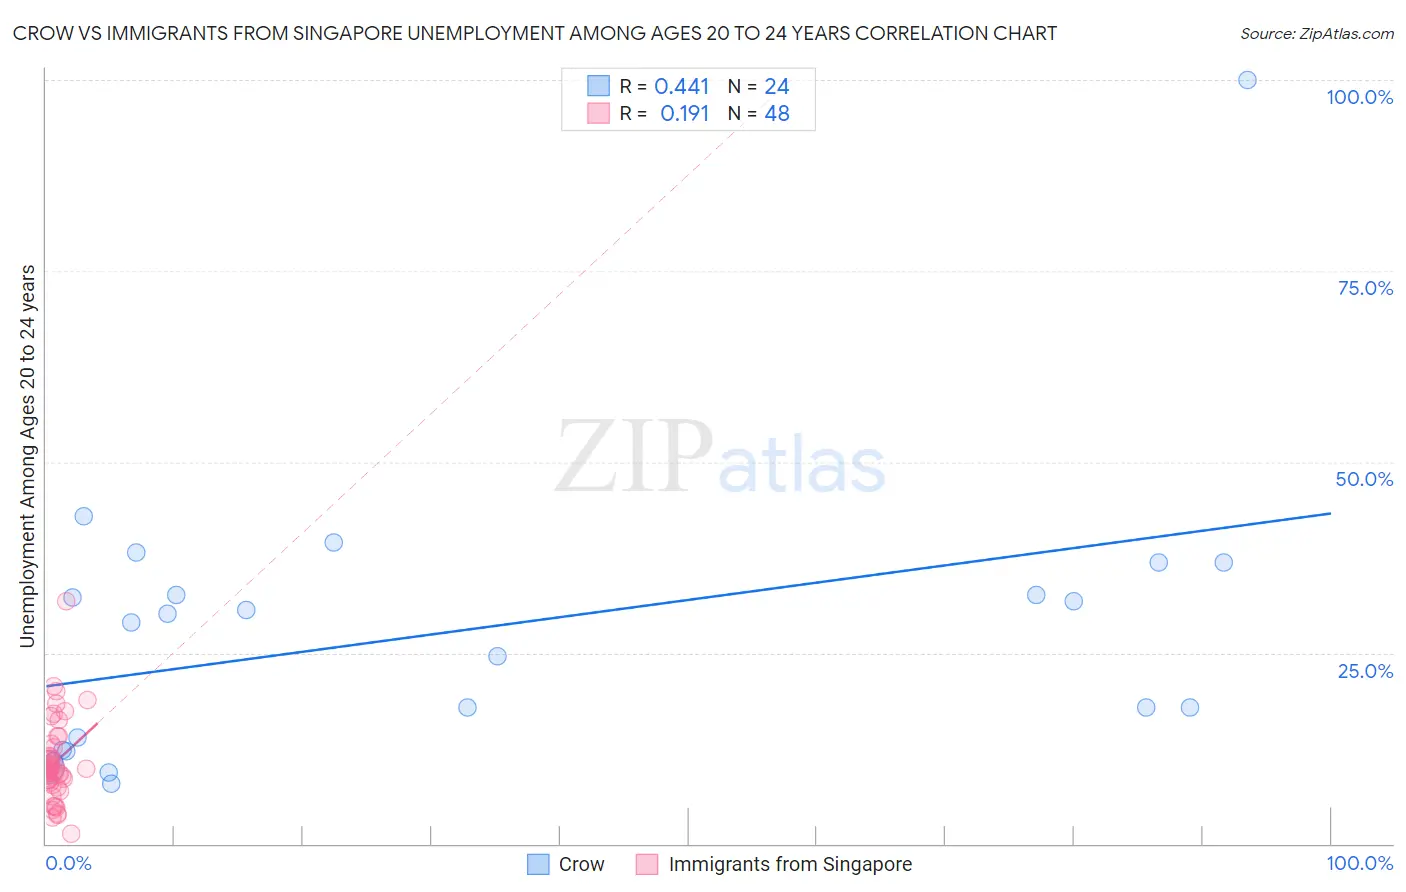
Crow vs Immigrants from Singapore Unemployment Among Ages 20 to 24 years Correlation Chart
The statistical analysis conducted on geographies consisting of 58,497,942 people shows a moderate positive correlation between the proportion of Crow and unemployment rate among population between the ages 20 and 24 in the United States with a correlation coefficient (R) of 0.441 and weighted average of 18.7%. Similarly, the statistical analysis conducted on geographies consisting of 136,327,336 people shows a poor positive correlation between the proportion of Immigrants from Singapore and unemployment rate among population between the ages 20 and 24 in the United States with a correlation coefficient (R) of 0.191 and weighted average of 9.8%, a difference of 90.6%.
Unemployment Among Ages 20 to 24 years Correlation Summary
| Measurement | Crow | Immigrants from Singapore |
| Minimum | 7.8% | 1.3% |
| Maximum | 100.0% | 31.8% |
| Range | 92.2% | 30.5% |
| Mean | 27.8% | 10.7% |
| Median | 29.6% | 9.7% |
| Interquartile 25% (IQ1) | 13.1% | 7.9% |
| Interquartile 75% (IQ3) | 34.7% | 12.9% |
| Interquartile Range (IQR) | 21.7% | 5.1% |
| Standard Deviation (Sample) | 19.0% | 5.5% |
| Standard Deviation (Population) | 18.6% | 5.4% |
Similar Demographics by Unemployment Among Ages 20 to 24 years
Demographics Similar to Crow by Unemployment Among Ages 20 to 24 years
In terms of unemployment among ages 20 to 24 years, the demographic groups most similar to Crow are Tsimshian (18.0%, a difference of 4.2%), Hopi (19.9%, a difference of 6.2%), Yup'ik (20.9%, a difference of 11.4%), Inupiat (20.9%, a difference of 11.7%), and Puerto Rican (16.7%, a difference of 12.5%).
| Demographics | Rating | Rank | Unemployment Among Ages 20 to 24 years |
| Immigrants | Guyana | 0.0 /100 | #333 | Tragic 13.9% |
| Guyanese | 0.0 /100 | #334 | Tragic 14.0% |
| Sioux | 0.0 /100 | #335 | Tragic 14.2% |
| Pima | 0.0 /100 | #336 | Tragic 14.2% |
| Paiute | 0.0 /100 | #337 | Tragic 14.3% |
| Immigrants | St. Vincent and the Grenadines | 0.0 /100 | #338 | Tragic 14.3% |
| Immigrants | Yemen | 0.0 /100 | #339 | Tragic 14.9% |
| Yuman | 0.0 /100 | #340 | Tragic 15.8% |
| Navajo | 0.0 /100 | #341 | Tragic 16.1% |
| Puerto Ricans | 0.0 /100 | #342 | Tragic 16.7% |
| Tsimshian | 0.0 /100 | #343 | Tragic 18.0% |
| Crow | 0.0 /100 | #344 | Tragic 18.7% |
| Hopi | 0.0 /100 | #345 | Tragic 19.9% |
| Yup'ik | 0.0 /100 | #346 | Tragic 20.9% |
| Inupiat | 0.0 /100 | #347 | Tragic 20.9% |
Demographics Similar to Immigrants from Singapore by Unemployment Among Ages 20 to 24 years
In terms of unemployment among ages 20 to 24 years, the demographic groups most similar to Immigrants from Singapore are British (9.8%, a difference of 0.010%), Serbian (9.8%, a difference of 0.010%), Welsh (9.8%, a difference of 0.080%), Malaysian (9.8%, a difference of 0.10%), and Immigrants from Kuwait (9.8%, a difference of 0.12%).
| Demographics | Rating | Rank | Unemployment Among Ages 20 to 24 years |
| Carpatho Rusyns | 99.6 /100 | #55 | Exceptional 9.8% |
| Nicaraguans | 99.6 /100 | #56 | Exceptional 9.8% |
| Immigrants | Moldova | 99.5 /100 | #57 | Exceptional 9.8% |
| Pakistanis | 99.5 /100 | #58 | Exceptional 9.8% |
| English | 99.5 /100 | #59 | Exceptional 9.8% |
| Immigrants | Kuwait | 99.5 /100 | #60 | Exceptional 9.8% |
| Malaysians | 99.5 /100 | #61 | Exceptional 9.8% |
| Immigrants | Singapore | 99.4 /100 | #62 | Exceptional 9.8% |
| British | 99.4 /100 | #63 | Exceptional 9.8% |
| Serbians | 99.4 /100 | #64 | Exceptional 9.8% |
| Welsh | 99.3 /100 | #65 | Exceptional 9.8% |
| Scottish | 99.3 /100 | #66 | Exceptional 9.8% |
| Immigrants | Bolivia | 99.2 /100 | #67 | Exceptional 9.9% |
| Mongolians | 99.1 /100 | #68 | Exceptional 9.9% |
| Bulgarians | 99.1 /100 | #69 | Exceptional 9.9% |