Cree vs Cuban Unemployment Among Ages 55 to 59 years
COMPARE
Cree
Cuban
Unemployment Among Ages 55 to 59 years
Unemployment Among Ages 55 to 59 years Comparison
Cree
Cubans
5.2%
UNEMPLOYMENT AMONG AGES 55 TO 59 YEARS
0.1/ 100
METRIC RATING
271st/ 347
METRIC RANK
4.2%
UNEMPLOYMENT AMONG AGES 55 TO 59 YEARS
100.0/ 100
METRIC RATING
9th/ 347
METRIC RANK
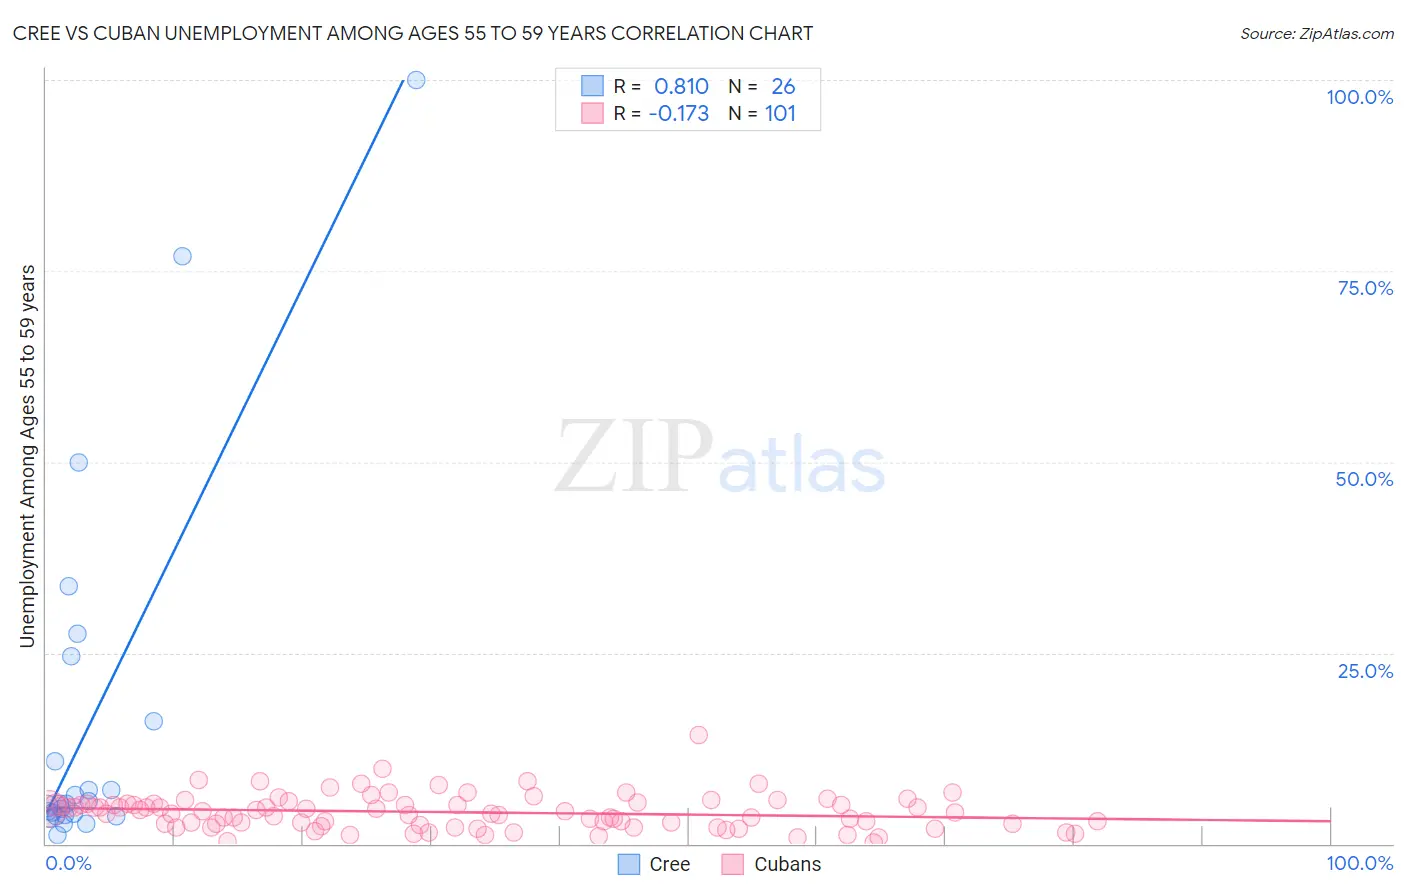
Cree vs Cuban Unemployment Among Ages 55 to 59 years Correlation Chart
The statistical analysis conducted on geographies consisting of 74,674,951 people shows a very strong positive correlation between the proportion of Cree and unemployment rate among population between the ages 55 and 59 in the United States with a correlation coefficient (R) of 0.810 and weighted average of 5.2%. Similarly, the statistical analysis conducted on geographies consisting of 413,111,885 people shows a poor negative correlation between the proportion of Cubans and unemployment rate among population between the ages 55 and 59 in the United States with a correlation coefficient (R) of -0.173 and weighted average of 4.2%, a difference of 22.4%.
Unemployment Among Ages 55 to 59 years Correlation Summary
| Measurement | Cree | Cuban |
| Minimum | 1.1% | 0.10% |
| Maximum | 100.0% | 14.3% |
| Range | 98.9% | 14.2% |
| Mean | 16.1% | 4.1% |
| Median | 5.2% | 4.1% |
| Interquartile 25% (IQ1) | 3.8% | 2.5% |
| Interquartile 75% (IQ3) | 16.1% | 5.2% |
| Interquartile Range (IQR) | 12.3% | 2.7% |
| Standard Deviation (Sample) | 24.4% | 2.3% |
| Standard Deviation (Population) | 24.0% | 2.3% |
Similar Demographics by Unemployment Among Ages 55 to 59 years
Demographics Similar to Cree by Unemployment Among Ages 55 to 59 years
In terms of unemployment among ages 55 to 59 years, the demographic groups most similar to Cree are Immigrants from Jamaica (5.2%, a difference of 0.17%), Ute (5.2%, a difference of 0.30%), Ottawa (5.2%, a difference of 0.40%), Tsimshian (5.2%, a difference of 0.47%), and Mexican (5.2%, a difference of 0.49%).
| Demographics | Rating | Rank | Unemployment Among Ages 55 to 59 years |
| Immigrants | Caribbean | 0.1 /100 | #264 | Tragic 5.2% |
| Yaqui | 0.1 /100 | #265 | Tragic 5.2% |
| Jamaicans | 0.1 /100 | #266 | Tragic 5.2% |
| Immigrants | Senegal | 0.1 /100 | #267 | Tragic 5.2% |
| Mexicans | 0.1 /100 | #268 | Tragic 5.2% |
| Tsimshian | 0.1 /100 | #269 | Tragic 5.2% |
| Ute | 0.1 /100 | #270 | Tragic 5.2% |
| Cree | 0.1 /100 | #271 | Tragic 5.2% |
| Immigrants | Jamaica | 0.0 /100 | #272 | Tragic 5.2% |
| Ottawa | 0.0 /100 | #273 | Tragic 5.2% |
| Mexican American Indians | 0.0 /100 | #274 | Tragic 5.2% |
| Israelis | 0.0 /100 | #275 | Tragic 5.2% |
| West Indians | 0.0 /100 | #276 | Tragic 5.2% |
| Immigrants | Latin America | 0.0 /100 | #277 | Tragic 5.2% |
| Immigrants | Barbados | 0.0 /100 | #278 | Tragic 5.2% |
Demographics Similar to Cubans by Unemployment Among Ages 55 to 59 years
In terms of unemployment among ages 55 to 59 years, the demographic groups most similar to Cubans are Bolivian (4.2%, a difference of 0.12%), Zimbabwean (4.2%, a difference of 0.23%), Norwegian (4.2%, a difference of 0.80%), Tongan (4.3%, a difference of 0.98%), and Immigrants from Bolivia (4.2%, a difference of 1.4%).
| Demographics | Rating | Rank | Unemployment Among Ages 55 to 59 years |
| Immigrants | Cuba | 100.0 /100 | #2 | Exceptional 4.1% |
| Immigrants | Venezuela | 100.0 /100 | #3 | Exceptional 4.1% |
| Venezuelans | 100.0 /100 | #4 | Exceptional 4.2% |
| Immigrants | Bolivia | 100.0 /100 | #5 | Exceptional 4.2% |
| Norwegians | 100.0 /100 | #6 | Exceptional 4.2% |
| Zimbabweans | 100.0 /100 | #7 | Exceptional 4.2% |
| Bolivians | 100.0 /100 | #8 | Exceptional 4.2% |
| Cubans | 100.0 /100 | #9 | Exceptional 4.2% |
| Tongans | 100.0 /100 | #10 | Exceptional 4.3% |
| Immigrants | Congo | 100.0 /100 | #11 | Exceptional 4.3% |
| Danes | 100.0 /100 | #12 | Exceptional 4.3% |
| Indonesians | 100.0 /100 | #13 | Exceptional 4.3% |
| Immigrants | India | 100.0 /100 | #14 | Exceptional 4.3% |
| Bulgarians | 100.0 /100 | #15 | Exceptional 4.3% |
| Somalis | 100.0 /100 | #16 | Exceptional 4.4% |