Hungarian vs Cuban Unemployment Among Ages 55 to 59 years
COMPARE
Hungarian
Cuban
Unemployment Among Ages 55 to 59 years
Unemployment Among Ages 55 to 59 years Comparison
Hungarians
Cubans
4.8%
UNEMPLOYMENT AMONG AGES 55 TO 59 YEARS
44.3/ 100
METRIC RATING
179th/ 347
METRIC RANK
4.2%
UNEMPLOYMENT AMONG AGES 55 TO 59 YEARS
100.0/ 100
METRIC RATING
9th/ 347
METRIC RANK
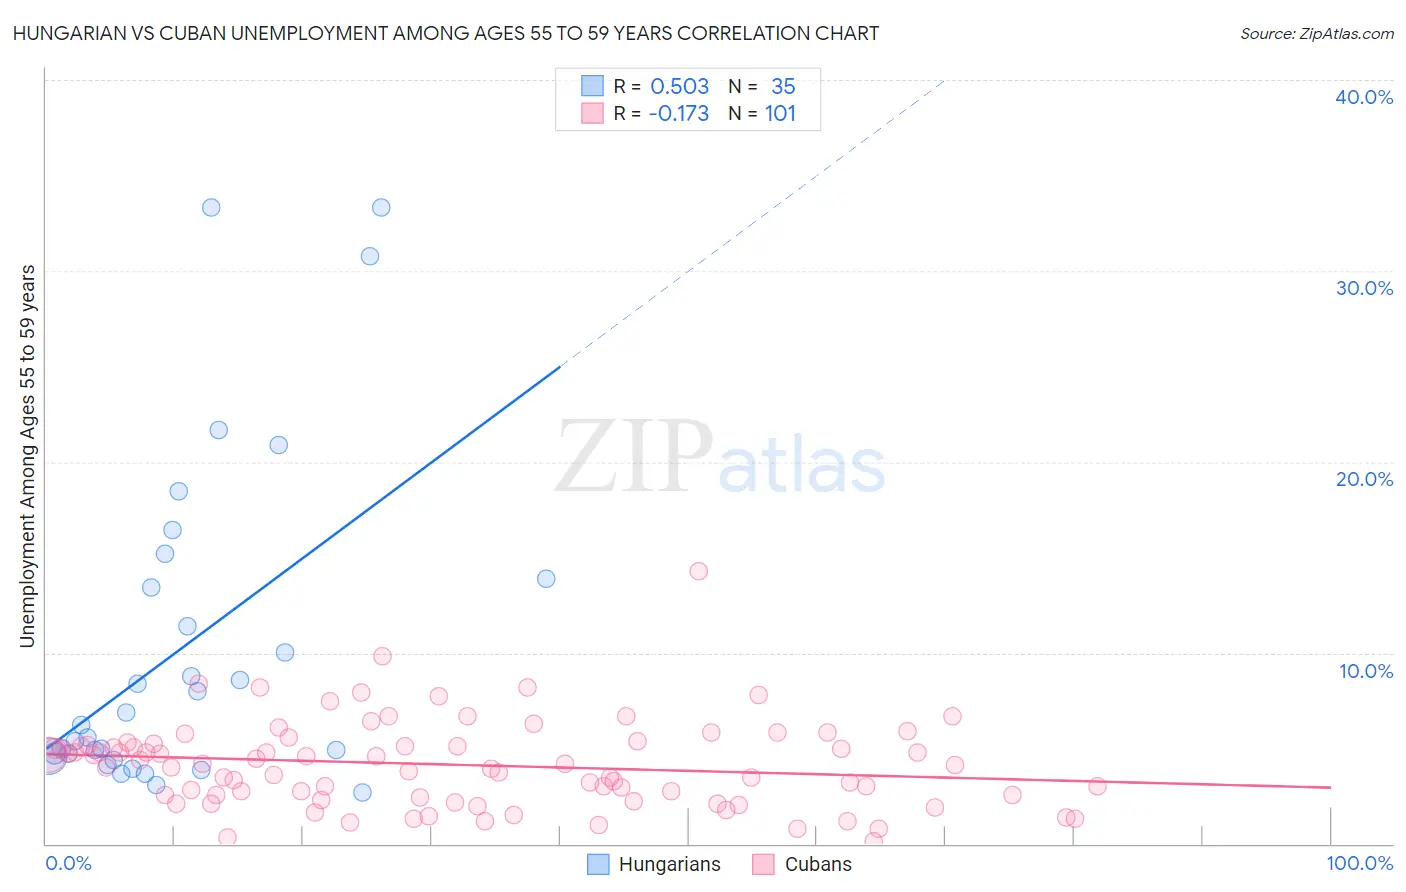
Hungarian vs Cuban Unemployment Among Ages 55 to 59 years Correlation Chart
The statistical analysis conducted on geographies consisting of 436,040,110 people shows a substantial positive correlation between the proportion of Hungarians and unemployment rate among population between the ages 55 and 59 in the United States with a correlation coefficient (R) of 0.503 and weighted average of 4.8%. Similarly, the statistical analysis conducted on geographies consisting of 413,111,885 people shows a poor negative correlation between the proportion of Cubans and unemployment rate among population between the ages 55 and 59 in the United States with a correlation coefficient (R) of -0.173 and weighted average of 4.2%, a difference of 13.9%.
Unemployment Among Ages 55 to 59 years Correlation Summary
| Measurement | Hungarian | Cuban |
| Minimum | 2.7% | 0.10% |
| Maximum | 33.3% | 14.3% |
| Range | 30.6% | 14.2% |
| Mean | 10.3% | 4.1% |
| Median | 6.2% | 4.1% |
| Interquartile 25% (IQ1) | 4.6% | 2.5% |
| Interquartile 75% (IQ3) | 13.9% | 5.2% |
| Interquartile Range (IQR) | 9.3% | 2.7% |
| Standard Deviation (Sample) | 8.6% | 2.3% |
| Standard Deviation (Population) | 8.5% | 2.3% |
Similar Demographics by Unemployment Among Ages 55 to 59 years
Demographics Similar to Hungarians by Unemployment Among Ages 55 to 59 years
In terms of unemployment among ages 55 to 59 years, the demographic groups most similar to Hungarians are South American (4.8%, a difference of 0.010%), Arab (4.8%, a difference of 0.020%), Immigrants from Sri Lanka (4.8%, a difference of 0.10%), Samoan (4.8%, a difference of 0.12%), and Immigrants from Hungary (4.8%, a difference of 0.16%).
| Demographics | Rating | Rank | Unemployment Among Ages 55 to 59 years |
| Nicaraguans | 54.0 /100 | #172 | Average 4.8% |
| Immigrants | Eastern Europe | 52.2 /100 | #173 | Average 4.8% |
| Immigrants | Croatia | 50.0 /100 | #174 | Average 4.8% |
| Australians | 48.6 /100 | #175 | Average 4.8% |
| Samoans | 47.1 /100 | #176 | Average 4.8% |
| Immigrants | Sri Lanka | 46.8 /100 | #177 | Average 4.8% |
| Arabs | 44.7 /100 | #178 | Average 4.8% |
| Hungarians | 44.3 /100 | #179 | Average 4.8% |
| South Americans | 44.0 /100 | #180 | Average 4.8% |
| Immigrants | Hungary | 40.4 /100 | #181 | Average 4.8% |
| Immigrants | Europe | 40.4 /100 | #182 | Average 4.8% |
| Immigrants | Peru | 38.6 /100 | #183 | Fair 4.8% |
| Immigrants | Czechoslovakia | 38.0 /100 | #184 | Fair 4.8% |
| Peruvians | 37.0 /100 | #185 | Fair 4.8% |
| Osage | 37.0 /100 | #186 | Fair 4.8% |
Demographics Similar to Cubans by Unemployment Among Ages 55 to 59 years
In terms of unemployment among ages 55 to 59 years, the demographic groups most similar to Cubans are Bolivian (4.2%, a difference of 0.12%), Zimbabwean (4.2%, a difference of 0.23%), Norwegian (4.2%, a difference of 0.80%), Tongan (4.3%, a difference of 0.98%), and Immigrants from Bolivia (4.2%, a difference of 1.4%).
| Demographics | Rating | Rank | Unemployment Among Ages 55 to 59 years |
| Immigrants | Cuba | 100.0 /100 | #2 | Exceptional 4.1% |
| Immigrants | Venezuela | 100.0 /100 | #3 | Exceptional 4.1% |
| Venezuelans | 100.0 /100 | #4 | Exceptional 4.2% |
| Immigrants | Bolivia | 100.0 /100 | #5 | Exceptional 4.2% |
| Norwegians | 100.0 /100 | #6 | Exceptional 4.2% |
| Zimbabweans | 100.0 /100 | #7 | Exceptional 4.2% |
| Bolivians | 100.0 /100 | #8 | Exceptional 4.2% |
| Cubans | 100.0 /100 | #9 | Exceptional 4.2% |
| Tongans | 100.0 /100 | #10 | Exceptional 4.3% |
| Immigrants | Congo | 100.0 /100 | #11 | Exceptional 4.3% |
| Danes | 100.0 /100 | #12 | Exceptional 4.3% |
| Indonesians | 100.0 /100 | #13 | Exceptional 4.3% |
| Immigrants | India | 100.0 /100 | #14 | Exceptional 4.3% |
| Bulgarians | 100.0 /100 | #15 | Exceptional 4.3% |
| Somalis | 100.0 /100 | #16 | Exceptional 4.4% |