Cree vs Immigrants from China Unemployment Among Ages 55 to 59 years
COMPARE
Cree
Immigrants from China
Unemployment Among Ages 55 to 59 years
Unemployment Among Ages 55 to 59 years Comparison
Cree
Immigrants from China
5.2%
UNEMPLOYMENT AMONG AGES 55 TO 59 YEARS
0.1/ 100
METRIC RATING
271st/ 347
METRIC RANK
5.0%
UNEMPLOYMENT AMONG AGES 55 TO 59 YEARS
4.2/ 100
METRIC RATING
226th/ 347
METRIC RANK
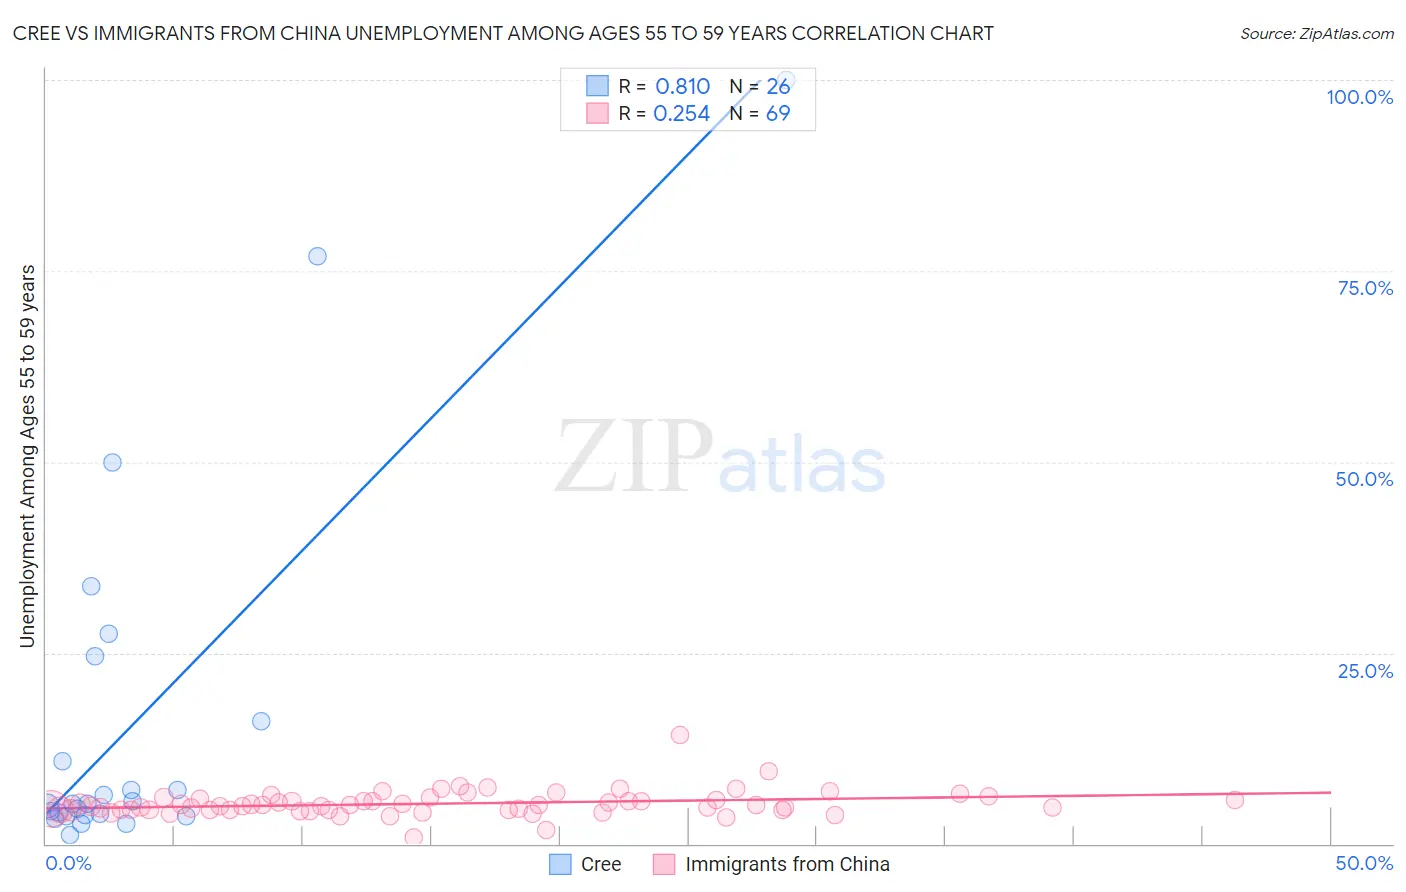
Cree vs Immigrants from China Unemployment Among Ages 55 to 59 years Correlation Chart
The statistical analysis conducted on geographies consisting of 74,674,951 people shows a very strong positive correlation between the proportion of Cree and unemployment rate among population between the ages 55 and 59 in the United States with a correlation coefficient (R) of 0.810 and weighted average of 5.2%. Similarly, the statistical analysis conducted on geographies consisting of 418,807,139 people shows a weak positive correlation between the proportion of Immigrants from China and unemployment rate among population between the ages 55 and 59 in the United States with a correlation coefficient (R) of 0.254 and weighted average of 5.0%, a difference of 4.4%.
Unemployment Among Ages 55 to 59 years Correlation Summary
| Measurement | Cree | Immigrants from China |
| Minimum | 1.1% | 0.82% |
| Maximum | 100.0% | 14.3% |
| Range | 98.9% | 13.5% |
| Mean | 16.1% | 5.3% |
| Median | 5.2% | 4.9% |
| Interquartile 25% (IQ1) | 3.8% | 4.4% |
| Interquartile 75% (IQ3) | 16.1% | 5.8% |
| Interquartile Range (IQR) | 12.3% | 1.4% |
| Standard Deviation (Sample) | 24.4% | 1.7% |
| Standard Deviation (Population) | 24.0% | 1.7% |
Similar Demographics by Unemployment Among Ages 55 to 59 years
Demographics Similar to Cree by Unemployment Among Ages 55 to 59 years
In terms of unemployment among ages 55 to 59 years, the demographic groups most similar to Cree are Immigrants from Jamaica (5.2%, a difference of 0.17%), Ute (5.2%, a difference of 0.30%), Ottawa (5.2%, a difference of 0.40%), Tsimshian (5.2%, a difference of 0.47%), and Mexican (5.2%, a difference of 0.49%).
| Demographics | Rating | Rank | Unemployment Among Ages 55 to 59 years |
| Immigrants | Caribbean | 0.1 /100 | #264 | Tragic 5.2% |
| Yaqui | 0.1 /100 | #265 | Tragic 5.2% |
| Jamaicans | 0.1 /100 | #266 | Tragic 5.2% |
| Immigrants | Senegal | 0.1 /100 | #267 | Tragic 5.2% |
| Mexicans | 0.1 /100 | #268 | Tragic 5.2% |
| Tsimshian | 0.1 /100 | #269 | Tragic 5.2% |
| Ute | 0.1 /100 | #270 | Tragic 5.2% |
| Cree | 0.1 /100 | #271 | Tragic 5.2% |
| Immigrants | Jamaica | 0.0 /100 | #272 | Tragic 5.2% |
| Ottawa | 0.0 /100 | #273 | Tragic 5.2% |
| Mexican American Indians | 0.0 /100 | #274 | Tragic 5.2% |
| Israelis | 0.0 /100 | #275 | Tragic 5.2% |
| West Indians | 0.0 /100 | #276 | Tragic 5.2% |
| Immigrants | Latin America | 0.0 /100 | #277 | Tragic 5.2% |
| Immigrants | Barbados | 0.0 /100 | #278 | Tragic 5.2% |
Demographics Similar to Immigrants from China by Unemployment Among Ages 55 to 59 years
In terms of unemployment among ages 55 to 59 years, the demographic groups most similar to Immigrants from China are Costa Rican (5.0%, a difference of 0.050%), Subsaharan African (5.0%, a difference of 0.060%), Immigrants from Ireland (5.0%, a difference of 0.13%), Immigrants from Iran (5.0%, a difference of 0.13%), and Spanish (5.0%, a difference of 0.20%).
| Demographics | Rating | Rank | Unemployment Among Ages 55 to 59 years |
| Immigrants | Nigeria | 8.0 /100 | #219 | Tragic 4.9% |
| Indians (Asian) | 7.6 /100 | #220 | Tragic 4.9% |
| Nigerians | 7.5 /100 | #221 | Tragic 4.9% |
| Spanish | 5.1 /100 | #222 | Tragic 5.0% |
| Immigrants | Ireland | 4.8 /100 | #223 | Tragic 5.0% |
| Sub-Saharan Africans | 4.4 /100 | #224 | Tragic 5.0% |
| Costa Ricans | 4.4 /100 | #225 | Tragic 5.0% |
| Immigrants | China | 4.2 /100 | #226 | Tragic 5.0% |
| Immigrants | Iran | 3.7 /100 | #227 | Tragic 5.0% |
| Immigrants | Liberia | 3.2 /100 | #228 | Tragic 5.0% |
| Immigrants | Western Asia | 3.0 /100 | #229 | Tragic 5.0% |
| Immigrants | Syria | 2.7 /100 | #230 | Tragic 5.0% |
| Cherokee | 2.6 /100 | #231 | Tragic 5.0% |
| Albanians | 2.5 /100 | #232 | Tragic 5.0% |
| Immigrants | Immigrants | 2.3 /100 | #233 | Tragic 5.0% |